
Part IV: A Simplified Approach to Determine IT Project Complexity.
A New Set of Metrics.
Abstract
This paper proposes a new set of metrics to minimize complexity for project and program management. It is based upon the prior work on the IT Core Complexity Model. It recommends a systemic approach establishing standards for IT departments and measuring progress against the standards. The resultant data collection and analysis could help businesses quantify risks and improve overall productivity.
Keywords
Project Complexity, Project Risks, Managing Projects, Project Complexity Formula, Project Difficulty, Risk Management, Project Metrics
Introduction
The Core IT Complexity Model argues that the parameters of resources, communication channels, stress, and roles primarily determine project complexity in a typical IT department. They are referred to as “core” complexity factors.
This paper is Part IV of a series on the subject of project complexity and refers to terms and concepts covered in the other papers identified below. For context purposes, the reader is encouraged to read the following cited under References.
- “A Simplified Approach to Determine IT Project Complexity”. This paper puts forth a rationale for a project complexity formula.
- “Part II: A Simplified Approach to Determine IT Project Complexity”. This paper discusses many of the factors that impact IT project complexity and argues that the number of resources, number of roles, and time are core indicators of complexity based upon the behavior of IT professionals.
- “Part III: A simplified Approach to IT Project Complexity”. This paper focuses on how communication affects complexity and strategies for minimizing its impact.
Developing Metrics
Since this paper introduces a new set of metrics, it must be based upon a foundation that can be supported quantitatively, no different from the project status metrics taught by the PMI Institute. For an organization to apply PMI Institute metrics, a project manager must have the necessary information to plug into their equations. It requires discipline and organization on the part of the team and the project manager to know the deviations from budget and schedule. Just the act of being able to measure is part of the benefit. Understanding the deviations from schedules implies that one has a schedule, which in itself is an achievement. In many cases, it is the journey that derives the benefit more so than the end result. The same applies to the data that must be collected to generate metrics for the IT Core Complexity Model. Ultimately, the results will help guide those who have control to manage their portfolios.
Let us look at defining standards for various aspects of a portfolio and then see how it relates to overall project complexity to establish the complexity metrics.
Overall Objective
As we learned from the first of the series of papers on the Core IT Project Complexity, the general formula is:
Complexity = (Communication Channels + Roles Complexity) X Stress.
Written as an equation: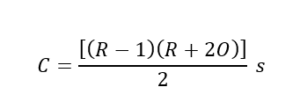
Where,
C = Complexity
R = number of resources on the (sub)team.
O = number of roles on (sub)team
S = stress factor for (sub)team.
(Note: On the first of this series of papers, Page 12, the denominator has 2A. Since S = 1/A, we use S in the numerator.)
The overall goal for all projects should be to organize them in a way such that the formula given above is at a minimum at any one point in time. One way to reduce the value of C is to reduce the number of communication channels. As discussed from Part III of this series, communications on the whole team can be broken down into communications within the sub-team, between sub-teams, stakeholders, steering committees, general team-wide executive communication updates, and Other communications outside the sub-teams. The entire set of communications on a team could then be represented as:
Total Project Communications Channels = sum of all sub-team communications + Stakeholder Communications + Steering Committee + General Communications + Other communications.
For a project team, General Communication and Other communication are not reduced by breaking a team into sub-teams. Therefore, communication channels can only be reduced for sub-team organization, Stakeholders, and Project Steering Committee. If the Steering Committee functions as a corporate governing body, it will fall into the same category as Other communications.
Therefore, applying the strategy of creating sub-teams then becomes the goal on exactly how best to organize the project for success and minimize complexity. If we make sub-teams too large, as shown in Part III of this series, communications grow exponentially and dramatically increase complexity.
[widget id=”custom_html-68″]
Defining “Core Resources”
For the purposes of the IT Core Complexity Model, resources are people resources, not software, equipment, or other types that could be classified as resources. “Core Resources” exclude Steering Committee members, VPs, Directors, Managers, and the like, whose role is to administrate, resolve risks and issues, and provide oversight. Their role is usually supportive. They are considered resources with infinite capacity and should never be constraints for a project. A project manager for a project is a core resource on a project, but their boss is not.
“Core resources” assigned on a project fall within one of the below categories.
- Business Expansion
- Shared Resources
- Production System Support
- Keep the Business Running (KBR)
Business Expansion are resources that perform a specific role and usually work on projects.
Shared Resources are those that support the IT Organization across all departments. Some examples of these are network engineers, database engineers, architects, QA test engineers, data center, and server engineers.
Production Support resources can be a dedicated team in some organizations working only on supporting production systems and fixing problems as they arise. These people are sometimes “on-call” to fix problems but also work on projects.
Keep the business Running (KBR) associates could be one or more people who perform maintenance of systems. Upgrades of servers, software, patches, and security upgrades. These are sometimes fixed teams or could be rotating and multitasking on projects.
For the purposes of this model, Production Support and KBR are considered projects for the period of time being evaluated. Though they do not fit the formal definition of a project, stress levels can be heavily impacted by these categories of activity. However, KBR and Production Support should be tracked separately for analysis. This is explained more under the topic of Standard Stress below.
New Standards
Based upon research from others in the field of project complexity, let us define a set of new standards that can be applied quantitatively in the IT Core Complexity Model.
Defining a Standard (Sub)Team Size (T)
In determining the most efficient size for a team, it does not matter if the team is the main team for a project or is a sub-team working on the same project. The optimum team size is five (5) people (Darren Brady, D. (n.d.).
“According to Katherine Klein from Wharton University, the widely accepted ideal size for a working team is five people. If you go beyond five people the team starts to lose individual performance, while teams smaller than 5 people can experience awkward team dynamics and skills gaps.
Klein’s research matches that done by other researchers around the world who have also tried to answer this question. The second most common answer to the question of ideal working team size is six people, as the dynamics of even versus odd numbered teams can cause some differences in opinion”.
In general, members on a project team or sub-team should be the resources executing the tasks and not a representative for the area. For shared resources who may not be assigned to participate directly on the team, having a representative who has role-based knowledge, who can then relay and coordinate the activities, is sometimes necessary. An example could be a DBA Manager who may have detailed knowledge of the subject, adding value to the subordinate DBAs and coordinating activities for their area. But, except for this generalized example, people assigned to a project team should be the resources executing the tasks as much as possible.
Defining a standard number of concurrent projects (P)
How many projects can one person work on concurrently? This is one of the most challenging and important topics that organizations need to contend with. On the one hand, managers want to maximize productivity, keep associates busy, and on the other hand, do not want to overload associates with too much work. A few studies have been conducted to determine how many concurrent projects any one person should work on to maximize productivity (H. Steyn1∗ & R. Schnetler, 2015). Their research concluded that two (2) technology projects was the best answer, potentially more, depending on the nature of the project. In that study, it was found that sometimes one project can help with another and feed off of each other, but after two (2) projects, productivity fell. Their conclusion, however, was that most organizations cross over this threshold. And not every project is the same, some projects may have multiple sub-teams, so in essence, one large project may be equivalent to several smaller projects, as the study stated.
They recommended that each IT organization establish a maximum number of projects allowed for each resource. Every organization and every project is unique, but this is a very subtle area, and participants may be eager to tackle more projects and work overtime; it should be more of an exception, not the rule. Very similar to someone driving a car and focused on driving, and then ask that driver to multitask cell phone calls and texts while listening to the radio. We all know what happens to that situation as we see it on the news every day. The point is that people take on more activities than they should without knowing the consequences until it’s too late. And therefore, for the purposes of this paper, we will use two (2) projects, including KBR and Production Support, as the standard number of projects any one individual can work on concurrently, assuming some of the projects having multiple sub-teams.
Standard number of concurrent (sub)teams (U)
This topic goes hand-in-hand with the maximum number of concurrent projects a person should be allowed to work, which was established as two (2) technology projects. The real question should be how many concurrent sub-teams should a person be allowed to work? This is a better unit measure for complexity and risk assessment than the maximum number of projects (P) above. There is no established standard for the maximum number of sub-teams on a project; applying common sense, a project with many resources should have a proportional number of sub-teams. For example, if a project has 20 core resources, and if we keep with the standard team size of five (5), the expectation would be close to 20/5 = 4 sub-teams.
The recommendation for establishing the maximum number of concurrent (sub)teams should be the same as recommended for the maximum number of projects allowed. Each IT organization should establish a threshold as a maximum by which, if exceeded, needs management approval.
Since we have established that a person can work on a maximum of two (2) projects concurrently, and most projects have at least two (2) sub-teams, we could set a threshold of four (4) concurrent (sub)teams.
Standard number of (sub) teams that an entire IT Organization should not exceed (M)
The standard formula for the maximum number of (sub)teams that an IT organization should not exceed is the total number of core resources in a department divided by standard team size multiplied by the maximum number of (sub) teams allowed for a person.
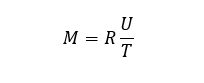
Where,
M = Standard number of (sub) teams in the IT organization
R = Total Core Resource Count in IT
U = Max Standard (Sub)Teams allowed (4)
T = Standard (Sub))Team size (5)
For example, let’s take an IT department with 500 Core IT employees, excluding VPs, Directors, and most management. And let’s say that management allows 4 (sub)teams per person. We could then calculate M as 500 times 4 divided by 5, or 400 (sub)teams. This of course would represent a goal and would be in a completely perfect distribution of resources where U and T are not exceeded. Organizations that deviate from this standard significantly will show in the resource Stress metric discussed below.
Standard Stress (S)
Stress (S) is a factor that has the most variability and measures the cumulative effect of adding projects into a portfolio. Once a project is launched and is beyond the Initiation Phase, resources and roles should be stable. However, depending on the stability of the portfolio, scope changes, or if other projects are being added, stress factors will increase, complexity will increase, and it could go unnoticed. This is precisely why complexity is a moving target and should be systemically evaluated weekly to determine resource constraints.
Additionally, a resource may be providing Production Support or Keep the Business Running activities. While those activities do not fit the traditional definition of a project, they do add stress. And not recognizing it would make the complexity determination less accurate. So, for the purpose of evaluating stress, those should be treated as a project for the time period in question.
In the Core IT Complexity formula, Stress = 1/A, where A is the average allocation %.. Stress (S) answers the question, “How many projects are being juggled concurrently for the time period in question?”. It is not how much time it takes to execute a particular task. Using the analogy of a person driving a car, if a person is driving, texting on their mobile device, and listening to the radio, their Stress factor would be 3. If they were just driving, then the Stress factor would be 1. Except where the finance department is tracking time against projects, it is not important to know that a task only took 5% or 10% of their time. This is why management will often ask people to break out allocations in chunks of time, e.g. 25%. For this complexity model, then the following formula applies:
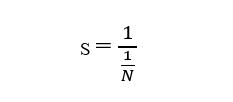
Where,
S = Stress
N = number of concurrent projects the person is working on at any particular point in time (usually 1 week). Again, as noted above, Production Support and Keep Business Running (KBR) are considered projects.
This simplifies to:
N
So, if a person is working on 3 projects, then the value of S = 3.
In the case of a team, the value of S would be the average number of projects the team members are working on for any given time.
Standard number of Roles (O)
For a sub-team, one could argue that each member should represent a role and to not duplicate roles. So, the standard number of roles on a sub-team is 5. However, this is only used in the IT Core Complexity formula when determining a standard for a (sub) team and not for analytical purposes. Obviously, there is no standard for the number of roles on a project at a project level.
Standard (Sub) Team Complexity
Plugging the standards above into the Core IT Complexity Model, we can say that the standard complexity for any one sub-team is: 
Overall IT Department Complexity
The workings of an entire IT Organization do not fit the definition of a project because it is an ongoing operation to support the business. However, if an entire IT Organization were to embark on a corporate-wide project, the formula for that complexity would be: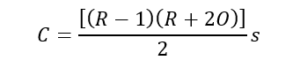
Where,
R = Total number of core IT resources in the IT Organization
O = Total number of roles for core resources in the IT Organization
S = Stress on the organization (average)
This is not intended to imply a capacity of the IT department. It simply states that the complexity of a corporate-wide project, where all IT core resources are working on the project, would be represented by that number. For example, let us say that an IT department has 100 core resources, 15 roles and dedicated 100% of the time with no other projects. Then the complexity score would be equal to 6,435.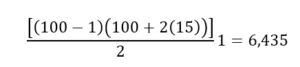
This number represents the upper limit of complexity for the department. All other projects with less resources and equivalent stress would be less complex. If other projects were then added into the portfolio, the stress level for the department project would increase depending on the number of resources impacted.
This is precisely why it is important to know that embarking on a wide-reaching project in IT but expecting it not to impact other projects is unrealistic. An example of such initiatives could be an ERP system or corporate-wide portfolio management system.
Portfolio Complexity
A portfolio of projects is a group of projects, each with separate teams. If P is a project and C(Pi) is the complexity of project i, then: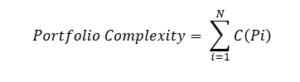
Where,
N = total number of projects in the IT department.
Stress Level for Portfolio
Total Stress for the Portfolio of projects is: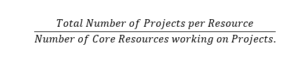
For example, if a portfolio had 15 core resources. Seven (7) resources are working on four (4) projects each, and the other eight (8) resources are each working on three (3) projects each, then the stress level for the portfolio would be [(7 x 4) + (8 x 3)]/ 15 = 3.5.
Comparing Project Complexities
A project with 20 resources, 5 roles, and on average each resource is working on 3 projects (S =3), then the complexity would equal 855.
Another project of 15 resources, 5 roles, and same stress level of 3, would equal 525.
One could take all the projects in a spreadsheet, align them in Project Complexity order for a relative ranking of projects.
Proposed Standards
Now that we have defined the standards for each of the variables, we can establish actuals vs. standards as it applies to the IT organization as a whole for program and project management.
Just to summarize the standards.
Standard (sub) team Size (T) = 5
Standard Number of Concurrent Projects (P) = 2
Standard Number of Roles on a Project (sub)team (O) = 5
Standard Number of Concurrent (sub)teams (U) = 4
Standard Stress = 2
Analysis
Given the standards defined above and the complexity formula, a new set of metrics can be established. We can describe this as a system in terms of inputs and outputs at a high level.
Inputs
- Projects (including Production Support and KBR)
- “Core” resources
- Resources working on each project
- Sub-teams on each project
- Resources working on sub-teams
- Roles of each person
Outputs
Project Data
- Number of resources on each project
- Number of resources on each sub-team
- Number of sub-teams each project has
- Number of projects each person is working on
New Metrics
- Identify overall project complexity for each project
- Rank projects by complexity
- Total portfolio complexity
- Rank portfolios by complexity
- Identify Stress by resource, project or portfolio
- Rank resources by Stress levels
- Identify resource constraints
- Identify and rank (sub) team complexity
- Show deviations from standards for risk assessment
Below are seven (7) reasons for the new set of metrics proposed. We should not lose sight of the overall purpose of collecting and analyzing this data. Projects and portfolios are a mix of assets and liabilities. The asset for a project is the value that a successful project delivers to a company. The liabilities of the project are the resources, time, and expenses the project incurs during its life.
- Establish goals to organize teams in such a way as to minimize complexity, reduce risks, and improve chances for success.
- Understand the complexity and risk of projects quantitatively as a function of resources, communication channels, roles, and stress as a moving entity.
- Have a common language that can be used across the business to describe project complexity.
- Rank projects and portfolios by complexity.
- Determine average stress levels on a project or portfolio.
- Identify resource constraints in an organization, project, or portfolio.
- Evaluate team structures against standards to reduce complexity.
Conclusion
Current PMI Institute project management metrics focus on individual project performance against schedules and budgets. Portfolio management systems provide a broad array of capabilities. However, there is a gap for metrics establishing standards and measuring complexity in an IT organization. Such metrics provide a means for a company to answer the question, “Given the core resources we have, is our IT organization of projects and portfolios most efficiently organized to minimize risk and complexity to the greatest extent possible?”. The metrics discussed in this paper are some thoughts on the subject, but there is a need for much more research and development on this topic.
References
Darren Brady, D. (n.d.). What is the Ideal Team Size for a Working Team? Total Team Building. Retrieved May 5, 2021, from https://www.totalteambuilding.com.au/ideal-team-size/
Steyn, H. & Schnetler, Rohann. (2015). Concurrent projects: How many can you handle?. The South African Journal of Industrial Engineering. 26. 10.7166/26-3-1104.
MacCue, C. (2021, March). A Simplified Approach to Determine IT Project Complexity. Project Times. https://www.projecttimes.com/articles/a-simplified-approach-to-determine-it-project-complexity.html
MacCue, C. (2021, April). Part II – A Simplified Approach to IT Project Complexity. Project Times. https://www.projecttimes.com/articles/part-ii-a-simplified-approach-to-determine-it-project-complexity.html
MacCue, C. (2021, May). Part III: A Simplified Approach to Determine IT Project Complexity. Communications and IT Project Complexity. Project Times. https://www.projecttimes.com/articles/part-iii-part-ii-a-simplified-approach-to-determine-it-project-complexity-communications-and-it-project-complexity.html