Author: Conrad MacCue

Part IV: A Simplified Approach to Determine IT Project Complexity.

A New Set of Metrics.

Abstract

This paper proposes a new set of metrics to minimize complexity for project and program management. It is based upon the prior work on the IT Core Complexity Model. It recommends a systemic approach establishing standards for IT departments and measuring progress against the standards. The resultant data collection and analysis could help businesses quantify risks and improve overall productivity.


Keywords

Project Complexity, Project Risks, Managing Projects, Project Complexity Formula, Project Difficulty, Risk Management, Project Metrics


Introduction

The Core IT Complexity Model argues that the parameters of resources, communication channels, stress, and roles primarily determine project complexity in a typical IT department. They are referred to as “core” complexity factors.

This paper is Part IV of a series on the subject of project complexity and refers to terms and concepts covered in the other papers identified below. For context purposes, the reader is encouraged to read the following cited under References.

  • “A Simplified Approach to Determine IT Project Complexity”. This paper puts forth a rationale for a project complexity formula.


  • “Part II: A Simplified Approach to Determine IT Project Complexity”. This paper discusses many of the factors that impact IT project complexity and argues that the number of resources, number of roles, and time are core indicators of complexity based upon the behavior of IT professionals.


  • “Part III: A simplified Approach to IT Project Complexity”. This paper focuses on how communication affects complexity and strategies for minimizing its impact.


Developing Metrics

Since this paper introduces a new set of metrics, it must be based upon a foundation that can be supported quantitatively, no different from the project status metrics taught by the PMI Institute. For an organization to apply PMI Institute metrics, a project manager must have the necessary information to plug into their equations. It requires discipline and organization on the part of the team and the project manager to know the deviations from budget and schedule. Just the act of being able to measure is part of the benefit. Understanding the deviations from schedules implies that one has a schedule, which in itself is an achievement. In many cases, it is the journey that derives the benefit more so than the end result. The same applies to the data that must be collected to generate metrics for the IT Core Complexity Model. Ultimately, the results will help guide those who have control to manage their portfolios.

Let us look at defining standards for various aspects of a portfolio and then see how it relates to overall project complexity to establish the complexity metrics.


Overall Objective

As we learned from the first of the series of papers on the Core IT Project Complexity, the general formula is:

Complexity = (Communication Channels + Roles Complexity) X Stress.


Written as an equation:

Where,

C = Complexity

R = number of resources on the (sub)team.

O = number of roles on (sub)team

S = stress factor for (sub)team.

(Note: On the first of this series of papers, Page 12, the denominator has 2A. Since S = 1/A, we use S in the numerator.)


The overall goal for all projects should be to organize them in a way such that the formula given above is at a minimum at any one point in time. One way to reduce the value of C is to reduce the number of communication channels. As discussed from Part III of this series, communications on the whole team can be broken down into communications within the sub-team, between sub-teams, stakeholders, steering committees, general team-wide executive communication updates, and Other communications outside the sub-teams. The entire set of communications on a team could then be represented as:


Total Project Communications Channels = sum of all sub-team communications + Stakeholder Communications + Steering Committee + General Communications + Other communications.


For a project team, General Communication and Other communication are not reduced by breaking a team into sub-teams. Therefore, communication channels can only be reduced for sub-team organization, Stakeholders, and Project Steering Committee. If the Steering Committee functions as a corporate governing body, it will fall into the same category as Other communications.

Therefore, applying the strategy of creating sub-teams then becomes the goal on exactly how best to organize the project for success and minimize complexity. If we make sub-teams too large, as shown in Part III of this series, communications grow exponentially and dramatically increase complexity.

[widget id=”custom_html-68″]

Defining “Core Resources”

For the purposes of the IT Core Complexity Model, resources are people resources, not software, equipment, or other types that could be classified as resources. “Core Resources” exclude Steering Committee members, VPs, Directors, Managers, and the like, whose role is to administrate, resolve risks and issues, and provide oversight. Their role is usually supportive. They are considered resources with infinite capacity and should never be constraints for a project. A project manager for a project is a core resource on a project, but their boss is not.


“Core resources” assigned on a project fall within one of the below categories.

  1. Business Expansion
  2. Shared Resources
  3. Production System Support
  4. Keep the Business Running (KBR)

Business Expansion are resources that perform a specific role and usually work on projects.

Shared Resources are those that support the IT Organization across all departments. Some examples of these are network engineers, database engineers, architects, QA test engineers, data center, and server engineers.

Production Support resources can be a dedicated team in some organizations working only on supporting production systems and fixing problems as they arise. These people are sometimes “on-call” to fix problems but also work on projects.

Keep the business Running (KBR) associates could be one or more people who perform maintenance of systems. Upgrades of servers, software, patches, and security upgrades. These are sometimes fixed teams or could be rotating and multitasking on projects.

For the purposes of this model, Production Support and KBR are considered projects for the period of time being evaluated. Though they do not fit the formal definition of a project, stress levels can be heavily impacted by these categories of activity. However, KBR and Production Support should be tracked separately for analysis. This is explained more under the topic of Standard Stress below.


New Standards

Based upon research from others in the field of project complexity, let us define a set of new standards that can be applied quantitatively in the IT Core Complexity Model.


Defining a Standard (Sub)Team Size (T)

In determining the most efficient size for a team, it does not matter if the team is the main team for a project or is a sub-team working on the same project. The optimum team size is five (5) people (Darren Brady, D. (n.d.).

“According to Katherine Klein from Wharton University, the widely accepted ideal size for a working team is five people. If you go beyond five people the team starts to lose individual performance, while teams smaller than 5 people can experience awkward team dynamics and skills gaps.
Klein’s research matches that done by other researchers around the world who have also tried to answer this question. The second most common answer to the question of ideal working team size is six people, as the dynamics of even versus odd numbered teams can cause some differences in opinion”.

In general, members on a project team or sub-team should be the resources executing the tasks and not a representative for the area. For shared resources who may not be assigned to participate directly on the team, having a representative who has role-based knowledge, who can then relay and coordinate the activities, is sometimes necessary. An example could be a DBA Manager who may have detailed knowledge of the subject, adding value to the subordinate DBAs and coordinating activities for their area. But, except for this generalized example, people assigned to a project team should be the resources executing the tasks as much as possible.


Defining a standard number of concurrent projects (P)

How many projects can one person work on concurrently? This is one of the most challenging and important topics that organizations need to contend with. On the one hand, managers want to maximize productivity, keep associates busy, and on the other hand, do not want to overload associates with too much work. A few studies have been conducted to determine how many concurrent projects any one person should work on to maximize productivity (H. Steyn1∗ & R. Schnetler, 2015). Their research concluded that two (2) technology projects was the best answer, potentially more, depending on the nature of the project. In that study, it was found that sometimes one project can help with another and feed off of each other, but after two (2) projects, productivity fell. Their conclusion, however, was that most organizations cross over this threshold. And not every project is the same, some projects may have multiple sub-teams, so in essence, one large project may be equivalent to several smaller projects, as the study stated.

They recommended that each IT organization establish a maximum number of projects allowed for each resource. Every organization and every project is unique, but this is a very subtle area, and participants may be eager to tackle more projects and work overtime; it should be more of an exception, not the rule. Very similar to someone driving a car and focused on driving, and then ask that driver to multitask cell phone calls and texts while listening to the radio. We all know what happens to that situation as we see it on the news every day. The point is that people take on more activities than they should without knowing the consequences until it’s too late. And therefore, for the purposes of this paper, we will use two (2) projects, including KBR and Production Support, as the standard number of projects any one individual can work on concurrently, assuming some of the projects having multiple sub-teams.


Standard number of concurrent (sub)teams (U)

This topic goes hand-in-hand with the maximum number of concurrent projects a person should be allowed to work, which was established as two (2) technology projects. The real question should be how many concurrent sub-teams should a person be allowed to work? This is a better unit measure for complexity and risk assessment than the maximum number of projects (P) above. There is no established standard for the maximum number of sub-teams on a project; applying common sense, a project with many resources should have a proportional number of sub-teams. For example, if a project has 20 core resources, and if we keep with the standard team size of five (5), the expectation would be close to 20/5 = 4 sub-teams.

The recommendation for establishing the maximum number of concurrent (sub)teams should be the same as recommended for the maximum number of projects allowed. Each IT organization should establish a threshold as a maximum by which, if exceeded, needs management approval.

Since we have established that a person can work on a maximum of two (2) projects concurrently, and most projects have at least two (2) sub-teams, we could set a threshold of four (4) concurrent (sub)teams.


Standard number of (sub) teams that an entire IT Organization should not exceed (M)

The standard formula for the maximum number of (sub)teams that an IT organization should not exceed is the total number of core resources in a department divided by standard team size multiplied by the maximum number of (sub) teams allowed for a person.

Where,

M = Standard number of (sub) teams in the IT organization

R = Total Core Resource Count in IT

U = Max Standard (Sub)Teams allowed (4)

T = Standard (Sub))Team size (5)

For example, let’s take an IT department with 500 Core IT employees, excluding VPs, Directors, and most management. And let’s say that management allows 4 (sub)teams per person. We could then calculate M as 500 times 4 divided by 5, or 400 (sub)teams. This of course would represent a goal and would be in a completely perfect distribution of resources where U and T are not exceeded.  Organizations that deviate from this standard significantly will show in the resource Stress metric discussed below.


Standard Stress (S)

Stress (S) is a factor that has the most variability and measures the cumulative effect of adding projects into a portfolio. Once a project is launched and is beyond the Initiation Phase, resources and roles should be stable. However, depending on the stability of the portfolio, scope changes, or if other projects are being added, stress factors will increase, complexity will increase, and it could go unnoticed. This is precisely why complexity is a moving target and should be systemically evaluated weekly to determine resource constraints.

Additionally, a resource may be providing Production Support or Keep the Business Running activities. While those activities do not fit the traditional definition of a project, they do add stress. And not recognizing it would make the complexity determination less accurate. So, for the purpose of evaluating stress, those should be treated as a project for the time period in question.

In the Core IT Complexity formula, Stress = 1/A, where A is the average allocation %.. Stress (S) answers the question, “How many projects are being juggled concurrently for the time period in question?”. It is not how much time it takes to execute a particular task. Using the analogy of a person driving a car, if a person is driving, texting on their mobile device, and listening to the radio, their Stress factor would be 3. If they were just driving, then the Stress factor would be 1. Except where the finance department is tracking time against projects, it is not important to know that a task only took 5% or 10% of their time. This is why management will often ask people to break out allocations in chunks of time, e.g. 25%. For this complexity model, then the following formula applies:

Where,

S = Stress

N = number of concurrent projects the person is working on at any particular point in time (usually 1 week). Again, as noted above, Production Support and Keep Business Running (KBR) are considered projects.

This simplifies to:

N

So, if a person is working on 3 projects, then the value of S = 3.

In the case of a team, the value of S would be the average number of projects the team members are working on for any given time.


Standard number of Roles (O)

For a sub-team, one could argue that each member should represent a role and to not duplicate roles. So, the standard number of roles on a sub-team is 5. However, this is only used in the IT Core Complexity formula when determining a standard for a (sub) team and not for analytical purposes. Obviously, there is no standard for the number of roles on a project at a project level.


Standard (Sub) Team Complexity

Plugging the standards above into the Core IT Complexity Model, we can say that the standard complexity for any one sub-team is:


Overall IT Department Complexity

The workings of an entire IT Organization do not fit the definition of a project because it is an ongoing operation to support the business. However, if an entire IT Organization were to embark on a corporate-wide project, the formula for that complexity would be:

Where,

R = Total number of core IT resources in the IT Organization

O = Total number of roles for core resources in the IT Organization

S = Stress on the organization (average)


This is not intended to imply a capacity of the IT department. It simply states that the complexity of a corporate-wide project, where all IT core resources are working on the project, would be represented by that number. For example, let us say that an IT department has 100 core resources, 15 roles and dedicated 100% of the time with no other projects. Then the complexity score would be equal to 6,435.

This number represents the upper limit of complexity for the department. All other projects with less resources and equivalent stress would be less complex. If other projects were then added into the portfolio, the stress level for the department project would increase depending on the number of resources impacted.

This is precisely why it is important to know that embarking on a wide-reaching project in IT but expecting it not to impact other projects is unrealistic. An example of such initiatives could be an ERP system or corporate-wide portfolio management system.


Portfolio Complexity

A portfolio of projects is a group of projects, each with separate teams. If P is a project and C(Pi) is the complexity of project i, then:


Where,

N = total number of projects in the IT department.


Stress Level for Portfolio

Total Stress for the Portfolio of projects is:


For example, if a portfolio had 15 core resources. Seven (7) resources are working on four (4) projects each, and the other eight (8) resources are each working on three (3) projects each, then the stress level for the portfolio would be [(7 x 4) + (8 x 3)]/ 15 = 3.5.


Comparing Project Complexities

A project with 20 resources, 5 roles, and on average each resource is working on 3 projects (S =3), then the complexity would equal 855.

Another project of 15 resources, 5 roles, and same stress level of 3, would equal 525.

One could take all the projects in a spreadsheet, align them in Project Complexity order for a relative ranking of projects.


Proposed Standards

Now that we have defined the standards for each of the variables, we can establish actuals vs. standards as it applies to the IT organization as a whole for program and project management.

Just to summarize the standards.

Standard (sub) team Size (T) = 5

Standard Number of Concurrent Projects (P) = 2

Standard Number of Roles on a Project (sub)team (O) = 5

Standard Number of Concurrent (sub)teams (U) = 4

Standard Stress = 2


Analysis

Given the standards defined above and the complexity formula, a new set of metrics can be established. We can describe this as a system in terms of inputs and outputs at a high level.

Inputs

  • Projects (including Production Support and KBR)
  • “Core” resources
  • Resources working on each project
  • Sub-teams on each project
  • Resources working on sub-teams
  • Roles of each person


Outputs

Project Data

  • Number of resources on each project
  • Number of resources on each sub-team
  • Number of sub-teams each project has
  • Number of projects each person is working on

New Metrics

  • Identify overall project complexity for each project
  • Rank projects by complexity
  • Total portfolio complexity
  • Rank portfolios by complexity
  • Identify Stress by resource, project or portfolio
  • Rank resources by Stress levels
  • Identify resource constraints
  • Identify and rank (sub) team complexity
  • Show deviations from standards for risk assessment


Below are seven (7) reasons for the new set of metrics proposed. We should not lose sight of the overall purpose of collecting and analyzing this data. Projects and portfolios are a mix of assets and liabilities. The asset for a project is the value that a successful project delivers to a company. The liabilities of the project are the resources, time, and expenses the project incurs during its life.

  1. Establish goals to organize teams in such a way as to minimize complexity, reduce risks, and improve chances for success.
  2. Understand the complexity and risk of projects quantitatively as a function of resources, communication channels, roles, and stress as a moving entity.
  3. Have a common language that can be used across the business to describe project complexity.
  4. Rank projects and portfolios by complexity.
  5. Determine average stress levels on a project or portfolio.
  6. Identify resource constraints in an organization, project, or portfolio.
  7. Evaluate team structures against standards to reduce complexity.


Conclusion

Current PMI Institute project management metrics focus on individual project performance against schedules and budgets. Portfolio management systems provide a broad array of capabilities. However, there is a gap for metrics establishing standards and measuring complexity in an IT organization. Such metrics provide a means for a company to answer the question, “Given the core resources we have, is our IT organization of projects and portfolios most efficiently organized to minimize risk and complexity to the greatest extent possible?”. The metrics discussed in this paper are some thoughts on the subject, but there is a need for much more research and development on this topic.


References

Darren Brady, D. (n.d.). What is the Ideal Team Size for a Working Team? Total Team Building. Retrieved May 5, 2021, from https://www.totalteambuilding.com.au/ideal-team-size/

Steyn, H. & Schnetler, Rohann. (2015). Concurrent projects: How many can you handle?. The South African Journal of Industrial Engineering. 26. 10.7166/26-3-1104.

MacCue, C. (2021, March). A Simplified Approach to Determine IT Project Complexity. Project Times. https://www.projecttimes.com/articles/a-simplified-approach-to-determine-it-project-complexity.html

MacCue, C. (2021, April). Part II – A Simplified Approach to IT Project Complexity. Project Times. https://www.projecttimes.com/articles/part-ii-a-simplified-approach-to-determine-it-project-complexity.html

MacCue, C. (2021, May). Part III: A Simplified Approach to Determine IT Project Complexity. Communications and IT Project Complexity. Project Times. https://www.projecttimes.com/articles/part-iii-part-ii-a-simplified-approach-to-determine-it-project-complexity-communications-and-it-project-complexity.html
 

Part III: A Simplified Approach to Determine IT Project Complexity. Communications and IT Project Complexity.

Abstract

This paper examines the topic of communications on a project relative to the subject of project complexity.
It examines the role that communications play on a project, its effect on project complexity, and how and why teams should be organized to maximize the value of communications. For context, this paper is Part III of a series of papers on the subject of project complexity. See Reference Section for those papers.

Keywords

Project Communications, Project Complexity, Project Risks, Managing Projects, Project Difficulty, Risk Management

Introduction

The subject of project complexity is a topic of research initially raised in the mid-90s, and there have been hundreds of papers written on that subject since. For context purposes, the term “Project Complexity” is not the same as a “Complex Project”. Below is a generally accepted meaning of the term “Project Complexity”.

“The distinction between the two is the nature of the relationships between the elements of the project system (Kiridena, S. & Sense, A.,2016)” as explained by Chapman. “For instance, large-scale engineering and construction projects are considered to be complicated projects, but they may not necessarily be complex projects (provided that the interactions with and the influences of the environment are trivial or rather predictable). If the nature of relationships between various elements of a project is such that interactions between elements are non-linear and, therefore, will result in emergent behavior of the system, then it has been referred to as a “truly” complex project (Whitty & Maylor, 2009; Maylor et al., 2008)”.

Defining Communications

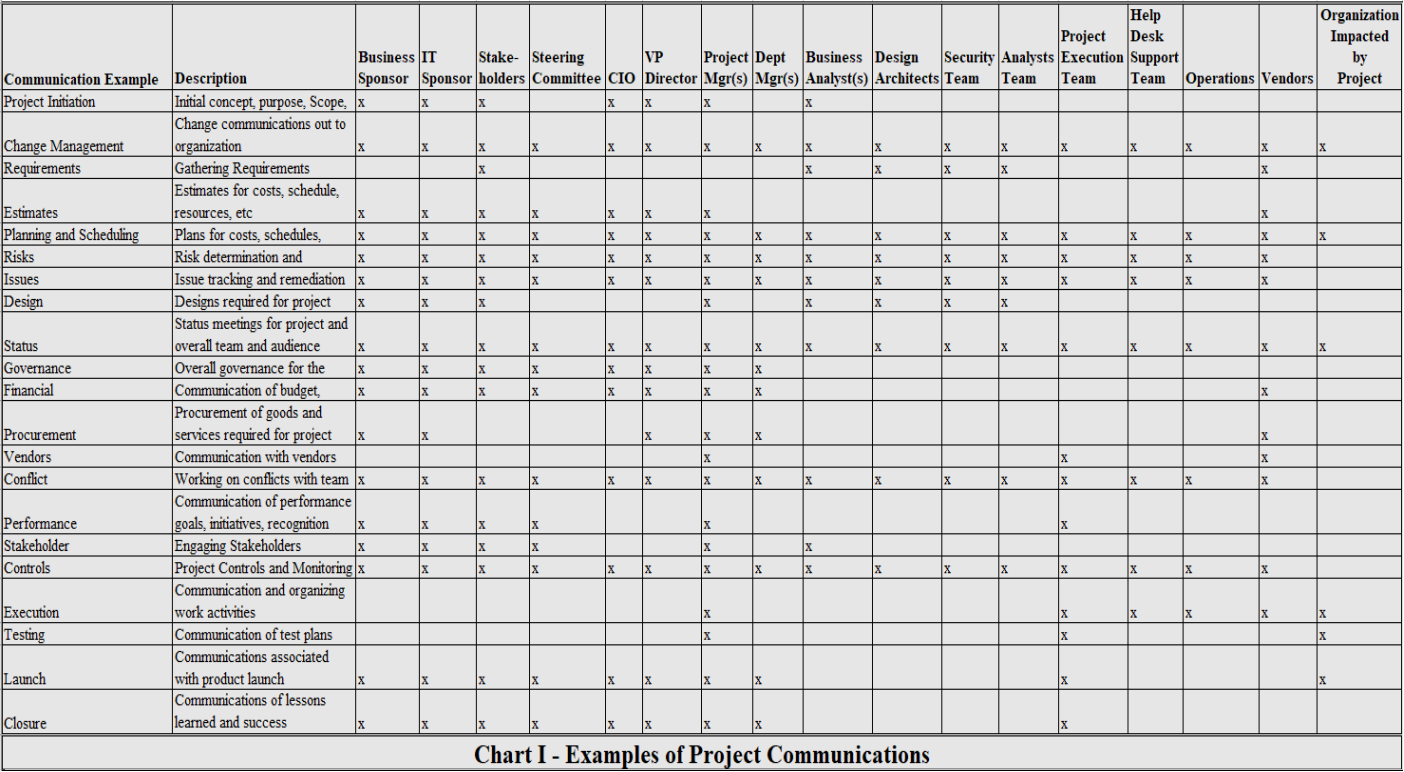
Communication is critical for a successful project. One such website provides 21 examples of communications on a project (John Spacey, 2017). That source listed the following examples of communications: Project Initiation: Change Management, Requirements, Estimates, Planning, and Scheduling, Risks, Issues, Design, Status, Governance, Financial, Procurement, Vendors, Conflict, Performance, Stakeholder, Controls, Execution, Testing, Launch, and Closure. The URL below is cited in the Reference Section.

https://simplicable.com/new/project-communication 

Mapping (Chart I below) the examples cited against the different roles on a typical IT project, one can understand the sheer magnitude of communications required for a successful project. Essentially everyone on a project will need a channel of communication open for one or more specific reasons. But as can be seen, not all communications are relevant for everyone on a team. Communications begins narrowly focused, then gradually picks up as the project moves from the Initiation Phase and onto the Planning Phase and peaks during the Execution Phase. If everyone on a large project had to attend every meeting and listen to everything said, it would be a significant waste of time that could otherwise be used for productive activities. On the other hand, team members not attending meetings related to their area of responsibility can lead to information loss and could negatively affect the project. Both situations of too much communication and too little communication lead to loss of time and increases the likelihood of risks and issues developing.


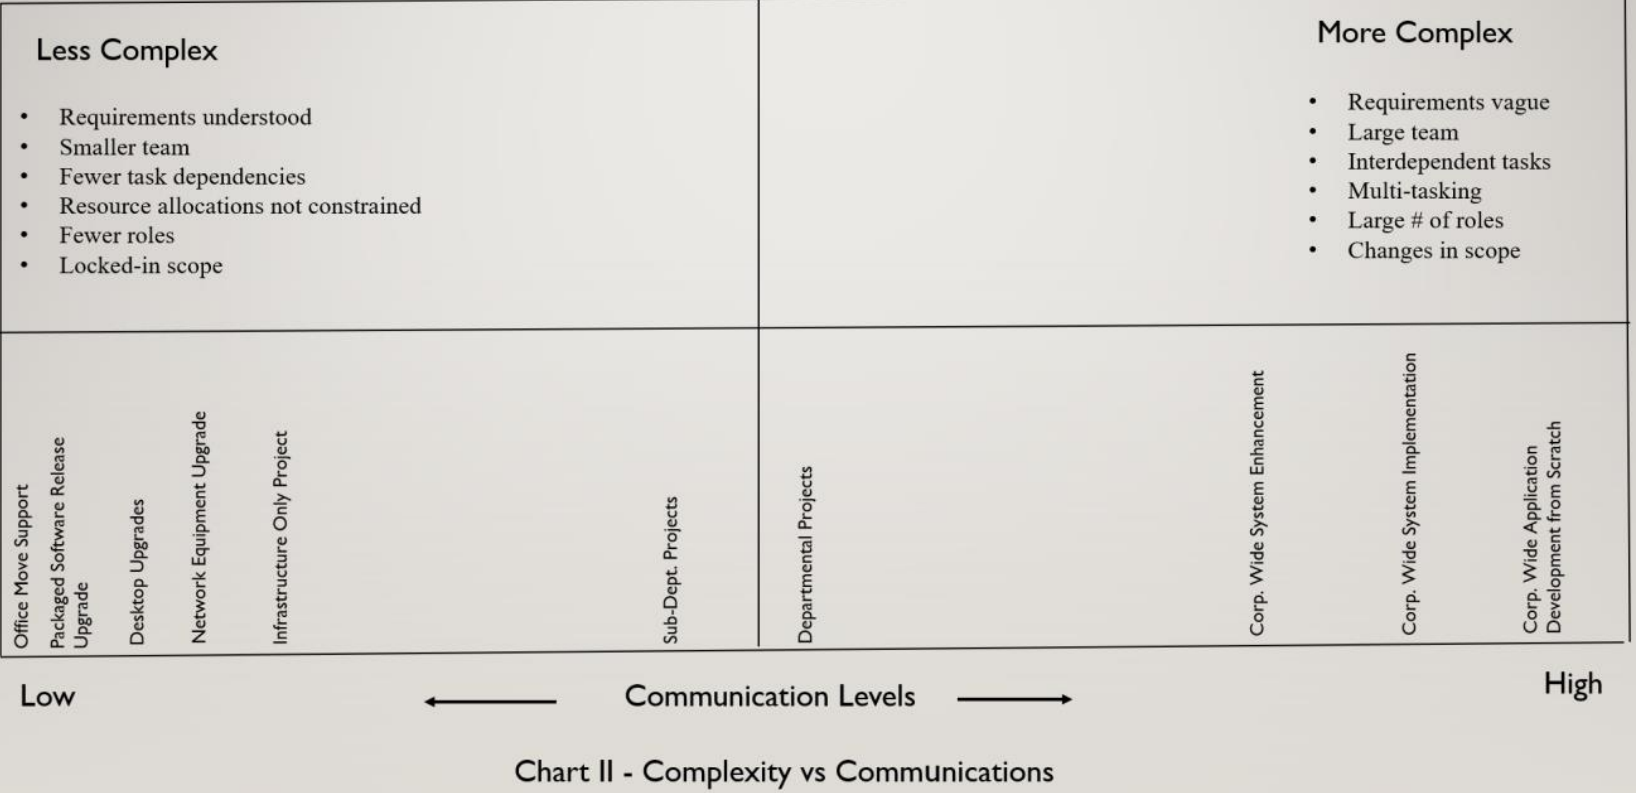
In general, the more communications required on a team, the greater the potential impact on project complexity. Chart II depicts the relationship between complexity and communications. On the upper right side of the chart listed are some of the factors that increase complexity and, on the left, reduce complexity. As we can see from the chart, the larger the customer base on the right, the greater the communication level, and the more complex. On the left, where the focus is on smaller audiences, the less complex. The scale applies to other factors as well. Projects that are more dynamic where requirements are not well understood could add more communications and complexity. This is why corporate-wide software development projects on a large scale are more complex than packaged software already developed and tested.  


Given the sheer magnitude and complexity of communications on a project, it is easy to see why it is critical to managing communications on a project strategically.

Organizing into Sub-Teams to Reduce Complexity

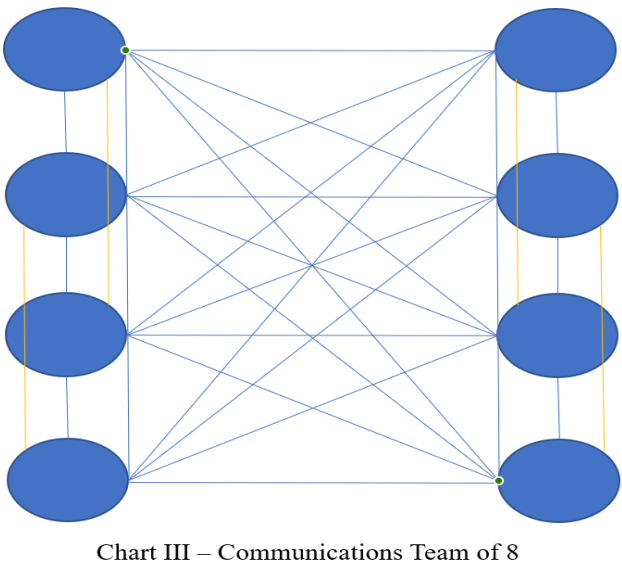
Regardless of the project team size or the level of complexity, communications must be managed so that important information is channeled and filtered appropriately. Doing so has the effect of increasing the value of communications and reducing project complexity. One such strategy that management will employ is to create teams within a project referred to as sub-teams. They usually are organized by role, function, or logical grouping that focuses on a particular purpose. To illustrate why communications on a project adds complexity, the below Chart III depicts a team of eight (8) resources on a project with the possible communication channels. The formula for the number of channels is R (R-1)/2 where R = # of resources.


Advertisement
[widget id=”custom_html-68″]


With eight (8) people on a team, there are 28 communication channels. One can easily visualize the chance for chaos. In a situation where meetings are occurring, and ideas are being exchanged openly, things could get out of control quickly. Add one (1) person into the team, and the communication channels increase to thirsty-six (36).

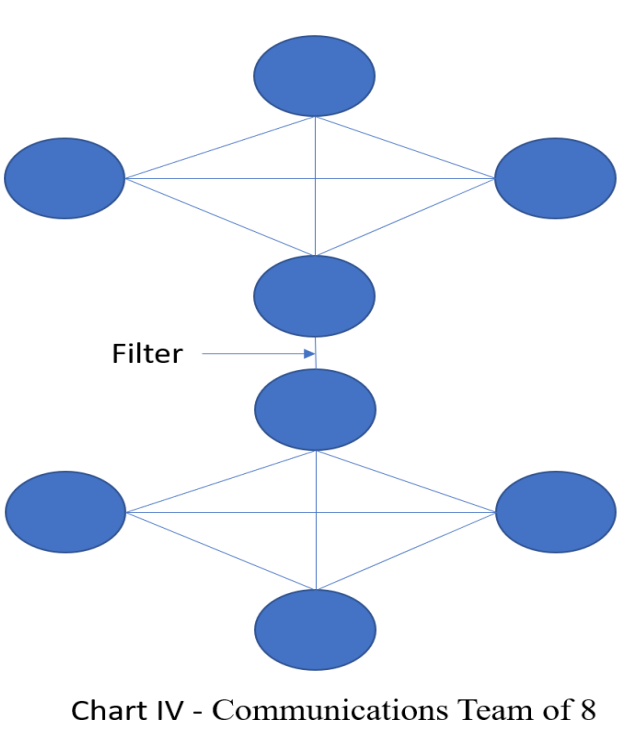
Now, if we take the same eight (8) resources and organize them as per below in Chart IV, divided into two (2) sub-teams, with a “Filter” in-between, we can reduce the number of communications channels by more than one-half, from twenty-eight (28) to thirteen (13). The “Filter” in this diagram represents resources that capture and share relevant information between sub-teams. This way of organizing the team provides for greater focus with less complexity.


On the other hand, if the filter is not functioning properly, important information could be lost. This situation often happens in the area of change control, where a change is made without communicating it across the entire project team, and an impact analysis is done without considering all areas of the business. Even with excellent team communication, it is a challenge. Clearly, creating sub-teams has its purpose when the focus is for a specific role where others do not need to participate or add no value. One could say that input to the sub-teams can be confined to the sub-team, but the output from the team should be communicated across the board so that everyone is aware of potential risks or issues. For this reason, we can categorically state that the sum of the sub-team communications does not add up to the required communications for the whole of the project. Moreover, that is why the overall complexity of a project remains higher with large overall team sizes even when they are most effectively organized.


Organizing a Project Team

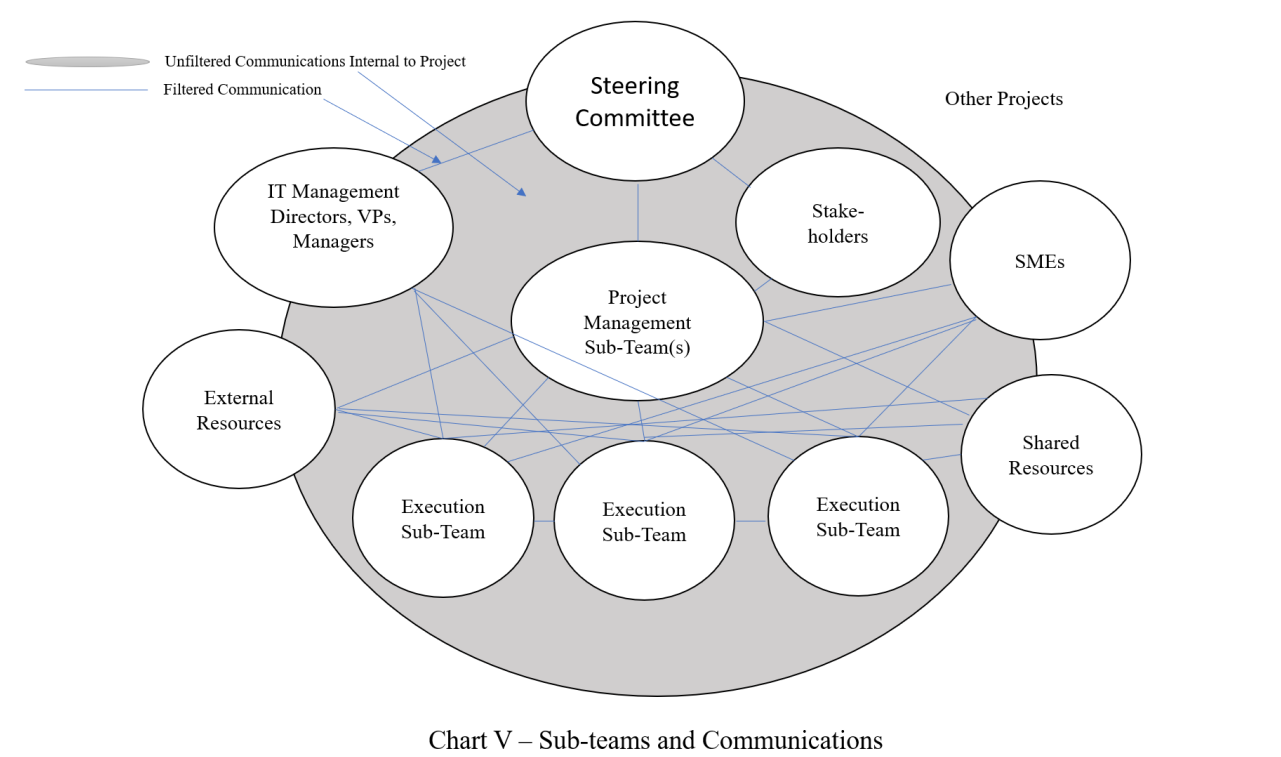
As one can visualize from Chart V, organizing a project team into logical groupings is a way to channel communications and reduce complexity. This is just an example, and the chart does not imply that all project teams should have a steering committee or SMEs. The project could use a Waterfall or Agile methodology. For example, the Project Management Sub-team(s) could be one or more Scrum Masters. Represented inside the shaded elliptical are all communications on a team, including sub-teams.  Some communications are filtered between sub-teams, and very important and not depicted on this chart are the communications happening inside each sub-team. Not all communications can be filtered. Some of the unfiltered communication is informal between team members, general communications to all team members, and other communication not specific to a sub-team. Most projects have breakout meetings related to resolving issues or drilling down into the details on a specific topic. Some of the unfiltered communication is necessary; some of it may not be. In addition, some of the sub-team resources could be working on other projects. In this example, a Steering Committee could be overseeing all projects, like a PMO board. Departmental Management VP/Director/Managers only get involved to resolve issues or risks and are generally not on the formal project team. SMEs could be used to seek advice on requirements or design and usually consulted sparingly. External resources could be vendor consultants. The sub-team that poses the most risk to the project is Shared Resources. Those resources might be required to execute a set of tasks, potentially working for a sub-team. An example might be installing a server, network equipment, database creation, or even establishing a firewall rule. Most likely, as the name implies, they are multi-tasking for a variety of initiatives, not necessarily confined to just project activity.

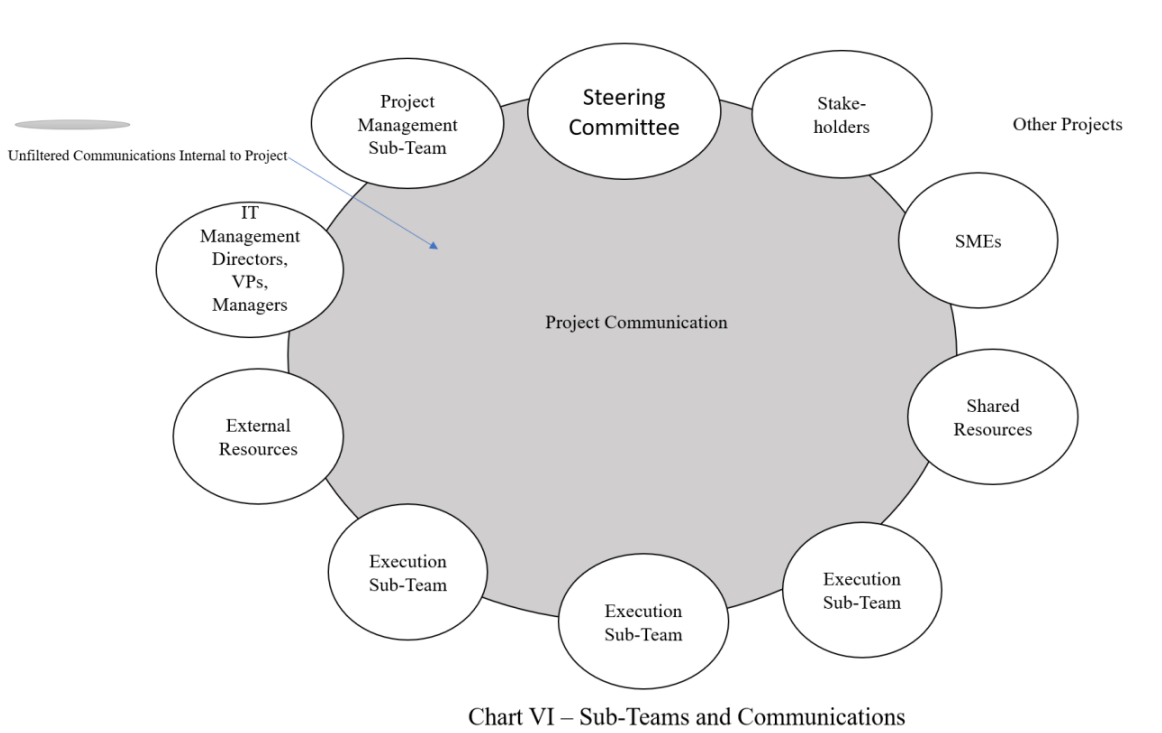
While Chart V depicts sub-teams mostly communicating on one (1) project, there are frequently situations depicted in Chart VI, where everyone on the team is multi-tasking on other projects. Resources are communicating within the project (shaded area) and the same for other projects as well.


There are not only the same number of internal communications happening as depicted on Chart V, but the same resources are communicating for other projects as well. This situation can add a lot of stress for certain resources and the entire project team. One can easily see why multi-tasking dramatically adds communications, increases complexity and risk to a project.

Conclusion

Communication on a project serves a variety of purposes and is critical for a project’s success. The entire life cycle of a successful project, from Initiation to Closure, depends on a variety of purposeful communications. In order to reduce complexity on a project, resources must be organized into smaller sub-teams which has the effect of reducing the total number of communications but, at the same time, adding value to the communication process by appropriately channeling and filtering the flow of information.


References

Spacey, John. “21 Examples of Project Communication.” Simplicable, Simplicable, 25 Oct. 2017.

https://simplicable.com/new/project-communication

Kiridena, S. & Sense, A. (2016). Profiling Project Complexity: Insights from Complexity Science and Project Management Literature. Project Management Journal, 47(6), 56–74.

MacCue, C. (2021, March). A Simplified Approach to Determine IT Project Complexity. Project Times. https://www.projecttimes.com/articles/a-simplified-approach-to-determine-it-project-complexity.html
MacCue, C. (2021, April). Part II – A Simplified Approach to IT Project Complexity. Project Times.

https://www.projecttimes.com/articles/part-ii-a-simplified-approach-to-determine-it-project-complexity.html
Part II: A Simplified Approach to Determine IT Project Complexity

Abstract

This paper is Part II of the paper entitled “A Simplified Approach to Determine IT Project Complexity”, (MacCue, C., 2021, March 5). Its purpose is to further explain the rationale behind the Core IT Complexity Model within the framework of the broader topic of IT project complexity. It will discuss why the Core IT Complexity model is a good approach for most IT organizations and why it is important to determine project complexity as an ongoing and integral part of the Change Management and Risk Management process.

Keywords

Project Complexity, Project Risks, Managing Projects, Project Complexity Formula, Project Difficulty, Risk Management

Introduction

There are many details and intricacies to consider when managing a complex project to its successful outcome. While that may seem obvious to many IT PM professionals, that is not necessarily the case with many business executives looking for payback from their expensive IT department. IT Executives are constantly justifying their department to the C-Level executives’ cries to exactly why “does IT need so many people, and what do they actually do”? IT is perceived by many as this black box where work gets done, but no one outside of IT really knows how. This is why many IT organizations are under constant pressure to re-organize or transform to new project management approaches to managing projects, improving visibility, and showing their contributions. Much credit should be given to organizations like the PMI Institute. They have made a science out of project management as much as possible and have provided roadmaps for maximizing the potential for success to the greatest extent possible. Most companies now seek project managers who follow the PMO processes like Waterfall or Agile and many C-Level executives support the PMO process. However, a formally adopted PMO process to implement and closely monitor projects and portfolios does not account for everything occurring in IT. And while meeting objectives in a project may be pleasing to stakeholders, it may not answer the question as to why does it take so long to do something that appears to be very simple? Or why can’t a task be done today rather than waiting for some other task to be completed first? Why can’t we add in a bunch of other projects to do so that an IT person can work on those when they are not doing anything? It’s this constant struggle of demonstrating an ROI from IT that makes the life of a CIO challenging. This is the reason for relatively high turnover rates of CIO and the adopted tag of ‘Career is Over’. Even IT executives who have come from the Non-IT worlds may have this perception and might explain why there is sometimes distrust within IT organizational management. 

For this, and many other reasons, as part of an overall risk assessment, the subject of project complexity should be taken seriously by executives when considering new IT projects. An understatement of a project’s magnitude can lead to an inaccurate ROI is where many IT Organizations introduce risks and instability into an IT organization. It will not eliminate all the CIOs problems, but it can help identify the projects upfront that have the greatest risk in the Initiation Phase before a project is launched. It can also indicate potential risks to existing projects. As viewed in this model, project complexity is intended to be a recurring process of evaluation and not a one-time fixed assessment at the beginning of the project. Moreover, the information derived from determining complexity can be used to rationalize overall work efforts in IT.

Background

This paper is not intended to provide readers with a holistic view of what project complexity is. There are hundreds of papers already written on that subject. One such paper “Profiling Project Complexity: Insights from Complexity Science and Project Management Literature.” (Kiridena, S. & Sense, A. 2016) synthesized views from 42 relevant papers on the subject matter and was able to classify them into 17 categories. That paper and the authors cited is a recommended reading for anyone interested in an all-encompassing view of project complexity.

To familiarize the reader with the subject of project complexity, below are three (3) important points from that paper.

  1.       A complex project is not the same as a complicated project. “The distinction between the two is the nature of the relationships between the elements of the project system (Kiridena, S. & Sense, A.,2016)” as explained by Chapman. “For instance, large-scale engineering and construction projects are considered to be complicated projects, but they may not necessarily be complex projects (provided that the interactions with and the influences of the environment are trivial or rather predictable). If the nature of relationships between various elements of a project is such that interactions between elements are non-linear and, therefore, will result in emergent behavior of the system, then it has been referred to as a “truly” complex project (Whitty & Maylor, 2009; Maylor et al., 2008)”.
  2.       The field of Project Complexity is wide-open and not well defined. (Kiridena, S. & Sense, A., 2016) state “However, our review of the literature reveals that such broad generalized statements about project complexity to be somewhat inadequate or incomplete, in terms of providing any guidance for project management practice or the development of appropriate tools and techniques to deal with complexity”.
  3.       The natural progression for the subject of project complexity is to narrow it to a specific industry. (Kiridena, S. & Sense, A., 2016) states “There have also been several recent attempts at developing frameworks or models for capturing and measuring project complexity within particular industry sectors (Chapman, 2016; Lu et al., 2015; Dunovic et al., 2014; Lessard et al., 2013)”.

The (3) three points above provide a basis to move forward then with the Core IT Complexity Model to achieve the objectives of:

(1) Expanding knowledge into the field of Project Complexity, drilling down into and applying it to the IT Industry,

(2) Using the guiding principle and common theme prevalent in all prior work on this subject in defining complexity as “non-linear interactions”.

Current Methods

Current methods for evaluating IT project complexity are limited and seem to fall into three (3) Tiers.

    1.       Tier 1: Non-existent. No assessment or evaluation. One can imagine a small to medium sized company with a few IT associates that are mostly supporting networking, desktops, mobile devices, where complexity is not relevant. It could be labeled production support.
    2.       Tier 2: Simple bucketing of low, medium, and high categories determined by someone who most likely has a “feel” of the project’s size. This individual would most likely be someone in the organization that has a good sense of the work involved and enters the data point into a system or spreadsheet associated with the project. Information is most likely not utilized for decision-making and has no supporting data.
    3.       Tier 3: Companies who have made an ongoing program out of determining project complexity. Methods are characterized by teams that have established a series of complexity criteria tailored to their environment and use spreadsheets or custom-developed applications. Their complexity modeling could be part of a larger overall Risk Management process.

Advertisement
[widget id=”custom_html-68″]

The Core IT Complexity Model in this paper fits somewhere in between Tier 2 and Tier 3 and is not intended as a replacement for Tier 3. If a company should choose to use a Tier 3 approach, it could lead to significant paybacks. One such method was successfully developed at Intel (McBride, M. 2014). Not only were they able to evaluate complexity, but they also used the data to estimate resources and project duration in a matter of minutes. It deployed a sophisticated approach referencing historical information and a scoring tailored to their environment. Another IT organization, Department of Information Technology, City of Seattle, Seattle, Washington, wrote a paper entitled “Early risk assessment in IT projects: integrating risk research into project management practice.”, (Taylor, H. A. & Artman, E. 2014). They included project complexity as a part of their comprehensive risk assessment program. There are other examples of deploying Tier 3 methods that can be found on the internet and in journals.

When appropriate, a Tier 3 model is best, but most companies do not adopt a structured method, particularly small and medium sized companies. One can imagine that the value of a Tier 3 approach would increase dramatically if it could be sponsored and accepted by business executives who could actively participate.

Proposed Method

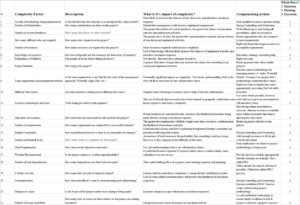
The Core IT complexity Model states that key complexity factors of the number of resources, roles, allocations, calculated team stress, and communications provide the most valuable information in determining project complexity for a Tier 2+ approach. Chart I depicts many of the factors that have potential to affect IT project complexity, how it affects complexity, and the compensating actions. There may be other factors, however, I do not believe that it would alter the analyses in this paper. The complexity factors are presented in time order sequence, identified by their project phase using phases from the PMI institute of Initiation, Planning, and Execution. The phases of Controlling and Closing are not applicable for the purposes of this paper.

Again, the common theme for project complexity is “non-linear interactions”, as cited under the Background section above. More predictability (linear) will mean greater anticipation and preparedness to deal with the situation, identify it as a risk before it becomes an issue.

Discussion

In reviewing the complexity factors in Chart I, we can see that one of the major challenges is that much of the information helpful to assess complexity is not known until later phases of a project. For example, how many lines of code, number of tasks, number of issues, number of task dependencies, the exact number of requirements, and whether or not they are understandable. And therefore, an IT department needs to use the little information it can gain based upon high-level discussions about the project, its goals, and high-level requirements. This could be the function of a PMO board that has a list of initial scoping questions that would be asked of SMEs. Whether there is a formal PMO process or not, ultimately, the assessment will require the involvement of IT department heads when projects enter the Initiation Phase. This leads to one of the fundamental understandings when applying the Core IT Complexity Model to a project.

IT Management intuitively thinks in terms of resources, roles, and time when assessing project complexity. IT Management department heads and managers understand what is going on in their departments. They understand the inventory of skillsets, resource knowledge, approximate utilization of resources, and the backlog in their departments. Moreover, when evaluating a new project, IT management will typically enlist knowledgeable resources to tackle the early initial determination of a project’s magnitude, feasibility, and high-level costs. They will involve other department managers and SMEs who will have a series of meetings as required to discuss feasibility and overall level of effort. The feasibility of using internal resources will be heavily weighted by the novelty of the technology being implemented. That will in turn determine whether outside consultants will be required. If the project initiation analysis continues, an overall scope will take shape. Over the course of time in the Initiation Phase, depending on the magnitude of the project, details will become more apparent, and a high-level Charter stating goals and deliverables can be developed. For experienced and mature department heads and their reliance on internal knowledge and past experiences, they will be able to formulate an overall resource plan along with a ballpark cost estimate. And this can be done without knowing the details of the project plan. For example, take an IT eCommerce project; anyone experienced in this field will know right off the top, that it would need roles of business analysts, database engineers, application engineers, infrastructure server engineers, networking engineers, IT security and architects to name a few. One can safely estimate that at least 10% of the time will be needed by the department managers to understand the high-level requirements. Before the project exits the Initiation Phase, most experienced managers can provide roles and time estimates for their resources to participate in the requirements gatherings. Once requirements are understood, a good ballpark estimate can be made for detailed engineering resources.

Therefore, as we can see from the above flow, resources, roles, and rough allocation of resources can be estimated early in the project life cycle. As the project matures, other qualitative and quantitative information will help right-size the team to keep pace once the project duration has been determined.

In some cases, for novel technologies where there are no prior experiences, consulting firms will need to be brought in to perform the analysis, and therefore resource and time estimations may take longer.

Compensating factors ultimately affect resources and/or allocations. Some other important observations can be made about the complexity factors in Chart I. The compensating actions for many of the complexity factors result in an adjustment to resources or allocations of time. For example, if we look at the number of systems interfaces, we see that having the correct number of resources and time to handle the scope of the interfaces would be required. Having clear requirements means that we have the right number of BA resources allocated to the team. Similar reasoning can be applied to project duration, time zones, number of detailed tasks, number of task dependencies, number of lines of code. Each would ultimately result in an adjustment to resources or allocated time to right-size the team for the tasks at hand.

There are qualitative complexities that this model does not address and cannot be solved by increasing resources, allocation of time, or adding more roles.

  1.       Knowledge of resources
  2.       Team organization
  3.       Communications (Value-added
  4.       Changes in Scope

Knowledge of resources is, of course, very important. A project with knowledgeable resources will be more likely to complete tasks on time with fewer issues and be less likely to introduce chaos into the project. Team organization is about adopting the suitable project management methodology for the project at hand and adherence thereto, recognizing that no one approach will fit each project. For example, using an Agile process for an Infrastructure project is not a good fit. Nor is using a highly structured planned-based (i.e. Waterfall) methodology for a highly dynamic software project (Butler, C. W., Vijayasarathy, L. R., & Roberts, N., 2020). But adhering to the steps established within the framework of the project methodology selected by the company is key and deviating will add more chaos affecting all team members. Communication that adds value to the project goals is key to a project’s success.

Conversely, communication that does not add value will steal time and resources away from the project and could potentially add confusion and chaos. A team with many roles will need more value-added communications between team members to collaborate and work on interdependent tasks. Communicating status to the team’s project manager and the executive team for risk and issue identification and resolution is critical to a project’s health. But of course, the more communication required, the greater the interactions required, and the greater the complexity. Finally, Changes in Scope need to be controlled to minimize impact on the overall project goals and timeline.

Conclusion

As shown above, the Core IT Complexity model uses key quantifiable data elements of resources, roles, allocations, and communication (channels) that are most likely to be estimated early in the project lifecycle to calculate a value for complexity. This approach is an improvement over a simplified Tier 2 level. (It does require that the IT department collect this information). It does not replace all the other strategic and qualitative decision-making that no system could ever replace. Applied effectively, it could be used to estimate a project’s complexity, provide useful input into the project initiation process, assess the impact on other projects being executed, and rank projects relative to each other in the portfolio. This data taken together with other qualitative information will provide company executives with better information to make decisions on project initiatives.

A Simplified Approach to Determine IT Project Complexity

This paper proposes a set of core factors that can be utilized to determine IT project complexity. It argues that the factors – number of resources, communications, team stress, and roles mostly determine IT project complexity.

Moreover, these factors can be assembled into an equation to calculate and score project complexity mathematically. The results can then be utilized objectively to evaluate a project’s relative complexity before, during, and after it is initiated. This paper also suggests that using a mathematical method to evaluate project complexity is a more objective and informative approach than using the traditional misleading one-time locked-in subjective complexity data points such as cost and buckets of low, medium, and high.

Introduction

One can look up the definition of project complexity under the PMI Institute, but essentially it is the sum of all factors that could affect the project’s outcome. There is no one widely accepted definition for project complexity. A definition provided (Hass, K. B. & Lindbergh, L. B., 2010), state that “Team size and composition, project duration, schedule, cost and scope flexibility, clarity of the problem and solution, stability of requirements, strategic importance, level of organizational change, inter-project dependencies, political sensitivity, and unproven technology” as the factors affecting project complexity.

Understanding a project’s complexity is essential to know in advance before a project is approved. Management needs to understand the risks involved as failure of a project could mean loss of money, valuable time, and lower employee morale. In this day and age of fast-paced technology, falling behind can sink a company. However, project complexity rarely gets the attention it should receive from executive management at corporations. Most companies do not spend the time doing a thorough analysis of a project’s complexity at the conception or later at the initiation phase. Many only look at the hardware, software, and consulting costs and do not consider the impact on internal resources or the probability of success. This view is particularly true for growing small to medium-sized corporations with no PMO function that review and evaluate projects considering all projects as part of a portfolio (a group of related projects). Most of the time, projects are selected into the portfolio based upon project payback and costs, and project complexity, if evaluated, is bucketed in low, medium, and high categories. And these determinations usually remain a one-time fixed occurrence. Moreover, once a project has been evaluated as having significant payback at the executive level, it becomes difficult to reverse course, even when the project has considerable, yet unknown complexity, and the risk of failure is high.

Quoted from a paper on the subject of project complexity by (Williamson, D. J., 2012), “Even the relatively general findings of this study indicate it may be helpful for practitioners to incorporate an assessment of project complexity into the initiation, planning, and execution phases of all IT projects. Wherever possible, proactive steps to mitigate the likely effects of IT project complexity may help improve the likelihood of IT project success. Further research into the relationships among individual factors and elements will help clarify these relationships”.

Many other scholarly papers have scrutinized a broad spectrum of possible influences on a project’s complexity. Some of these papers have developed evaluation criteria for measuring and determining project complexity. One such paper, (Yugue, R. T. & Maximiano, A. C. A., 2012), cover this topic quite extensively. There are others (Kathleen B. Hass, n.d). However, all the methods detailed in these papers require very knowledgeable and experienced staff who have an intimate understanding of a company’s culture, organizational capabilities, and project requirements. And for companies that do not have that level of sophistication in their organization, using an overly simplistic approach to determining complexity is inadequate and misleading. It allows risks to be introduced into the project or portfolio, which can later turn into major issues. Ultimately driving inefficiencies and waste into the organization.

Some companies utilize enterprise-wide portfolio management systems to evaluate the impact of proposed projects on resources and determine risks. These systems can provide a sophisticated analysis of a portfolio of projects looking at the complete picture of cost, resource conflicts, and an ROI. However, the output of these systems is only as good as the information entered. Implementing such a system in a large organization needs to be holistic and is a monumental project unto itself, and many fail to achieve their goals. Once the system is implemented, it requires corporate investment in highly skilled, trained, and dedicated committed resources. For the companies that can afford it and have many projects, it is a good approach in the long run. But many of these systems do not comprehensively provide methods for determining project complexity on an ongoing basis.

A Different Approach

Wouldn’t it be better to have a more straightforward way of determining project complexity without performing a full-blown assessment but would be more extensive than the standard bucketing approach? Most projects do not have all possible variables influencing their complexity. For example, resources at most companies are knowledgeable, have adequate tools, or the tools they have do not negatively impact projects, and usually, Business Analysts can generate clear requirements, similarly with other resources. It’s reasonable to assume that companies employ qualified resources and do not take on projects that are not a good fit for the organization. In this proposed model, we consider only the major factors that influence at least 80% of a project’s complexity, which is more than adequate for most company projects, particularly IT projects. These factors are referred to as core complexity factors in this paper.

Let us look at a basic way of determining core complexity that is quantitative in its approach and uses information that would be readily available via a project’s charter or some other research provided early in the project. This paper will proceed first to describe in detail each of the four (4) core factors that heavily influence a project’s complexity and then will proceed to explain the impact of each factor on overall project complexity. And finally, tie them together in a formula and describe how it can be applied in an organization.

Methods

Dimension 1 – Resources

The most crucial data used to determine a project’s complexity is its people resources. The number of resources on a project establishes the magnitude of a project and is a core determining factor for a project’s complexity regardless of the goals. In general, as the number of resources increases, so does the complexity. There must be adequate resources to complete the tasks according to the project schedule, and adding more resources to a project may reduce the duration for some activities. For example, a project that requires 2,000 lines of code could be distributed amongst four Developers to generate 500 lines of code each. Nevertheless, as the number of resources increases, the coordination effort, and the communication between resources grows, and so does the complexity, regardless of the duration of selected tasks. Anyone making a required contribution to a project will need to be included as a project resource. These include core participants but also should include subject matter experts, stakeholders, and shared resources. Many times, project management do not include these as part of the team. Anyone participating in a project needs to be accounted for. It also should be noted that a project with knowledgeable resources will be able to complete tasks most efficiently without confusion and delay. However, it is assumed that for this model, all resources are knowledgeable.

Dimension 2 – Communication Channels

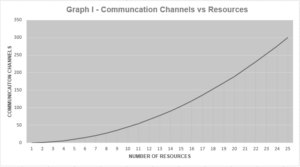
As the number of resources increases on a project, the number of possible avenues of communication increases. The PMI Institute defines these as Communication Channels. The formula from PMI Institute is CC = R (R – 1)/2, where R, in this case, is the number of resources. Communication Channels (CC) grows exponentially as R increases. For example, a project with resources A and B will have one communication channel. A project with A, B, and C resources will have three communication channels: A – B, A – C, B – C. There is a high correlation between the number of communication channels and complexity. A task in a project that is not dependent on communication between people is a lower risk task than the same task that requires significant communications.

Below is a graph (Graph I) followed by a chart (Chart I), depicting the relationship between the number of resources and communication channels. As one can see, as the number of resources increases linearly, the number of communications channels grows exponentially. The greater the number of communications required to execute a project successfully, the greater the chance for misunderstanding and risks developing in the handoff between resources. And the greater the complexity.

Another way of looking at the communications channels is to depict it as shown below in Chart 1. Each resource (R) can speak with any of the other resources on the project. As we see in this example of a project with 25 resources, there are 300 possible combinations, or using the formula R(R-1)/2; we have 25(24)/2 = 300 Communication Channels.

Dimension 3 – Roles

Expanding the communication channels into further dimensions, one must look at the different levels of expertise required or roles on a project. We will define roles as a group consisting of one or more resources who have the knowledge to perform a set of distinct functions in an organization. Roles add another layer of complexity on top of Communications Channels. Each role consists of a subset of team members working with the entire team to define the requirements, translate the requirements into tasks, and then execute those tasks for one or more customers. Communication between roles is more complex than within the same role. For example, take a software project with five (5) people who all perform the role of Developer. If the project is managed properly, each Developer will already understand the requirements, and each would develop the code required. Since each Developer speaks the same “Developer Language”, communications should be well understood between Developers without significant complexity. Now take another project that needs (1) BA, (1) Developer, (1) DBA, (1) QA Analyst, (1) Network Engineer. Both projects need five (5) resources, the same number of Communication Channels, but the latter project would require handoff and communication between the roles to define, understand, and execute different activities. The Business Analyst (BA) would state the requirements, either as an Agile Story or other requirements document. The requirements document would then need to be reviewed and approved by Stakeholders. After approval of the requirements, Developers will need to review and interpret the documents and develop the code. The Developers would then need to work with the DBAs to define and create the databases. In most situations, the outcome of the coding always needs testing by QA followed by some revamping to align with requirements. It would be a similar situation with the Network Engineers; the requirements such as firewall rules and IT Security would need to be defined, reviewed, and executed.

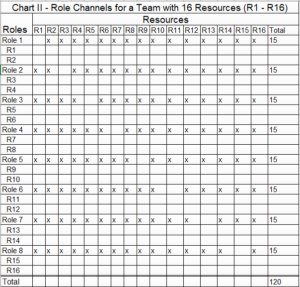
Therefore, in this simple example above, it is entirely clear that as the number of roles increases on a project, so does its complexity. Furthermore, it is not unreasonable to state that the size of the team significantly influences its impact on complexity. The exact determination depends on each project, but in general, roles on a large project have more requirements to satisfy, more communications, and more work to execute. Chart II below depicts that work effort as the possible combinations of communications. As can be seen, the greater the number of roles, the greater the complexity.

Roles in Chart II consist of eight (8) groups of people; each role has two (2) resources for illustration purposes. Each role will need to work with the other individual team members to define and execute the requirements. So, for Role 1, R1 communicates with resources R2 – R16.  For Role 2, R3 communicates with R1, R2, and R4 – R16, so on and so forth. Therefore, the equation that states the magnitude of that relationship is given by the formula:

Role Complexity = Number of Roles X (Resources – 1).

Unlike the Communication Channels, the order of the relationship is important so that for example, the relationship of Role 1 – R2 is not the same as R2 – Role 1.

Dimension 4 – Stress and Average Team Allocation %

The dimension with the most significant potential for risk and complexity on a project is Stress (S).

Stress is defined as:

S = 1 / Team Average Allocation %

Stress is the average % of time the team is allocated to the project, totaling each team member’s average allocation % and dividing it into 1. The higher the number S, the greater the stress on a project, the greater the complexity, and risk to the project. The ideal situation for a team working on a project is a dedicated co-located team setting where everyone is close by and spending 100% of their time on the project. In this situation, communication between team members flows most efficiently. There are no shared resources or multi-tasking on other projects. All resources to complete all the tasks are on the team. In this approach, Stress (S) is equal to 1 and is the lowest value for S.

Advertisement
[widget id=”custom_html-68″]

This “co-location” approach also happens to be the most expensive of the options. Most companies will have multi-tasking resources working on several projects across a portfolio of projects. Resources that multi-task fall into three categories: shared resources, subject-matter experts (SMEs), and part-time team members. Shared resources are usually those that belong to resource “pools” like DBAs, networking, server engineers, etc. SMEs are those people who have knowledge in an area that can benefit a team, particularly when defining up-front requirements or design of a product. Part-time resources are those resources that are splitting up their time between projects. And the greater the number of multi-tasking resources on a project, the greater the stress. As stress levels increase on team members, communications must be tightened for multi-tasking team members, and execution must become more precise. Sometimes the team members must work overtime to meet total work commitments, but the risk of making errors increases dramatically. Everyone has heard someone say, “Don’t rush me, or I am going to make a mistake”. In these situations, project stress factors can vary weekly, making the project manager’s job much more difficult.

In this complexity model, all resources that could add complexity to the project must be accounted for. There is no one-size-fits-all approach; the Project Manager using this model will need to distinguish between ‘availability’ of a resource and ‘allocation’. If shared resources are well-staffed and have virtually infinite capacity, then it would be best to leave those resources from the Stress equation. The same reasoning could apply to SMEs if their time requirement is low. The more concerning of the multi-tasking resources are those who are stretched thin, bouncing between projects. Examples of these could be Project Managers working on multiple projects, Developers, Network Engineers, or QA resources.

Each project resource allocation will have to be evaluated appropriately by the Project Manager or Analyst performing the complexity evaluation.

Complexity Formula – Describing Complexity as a Formula

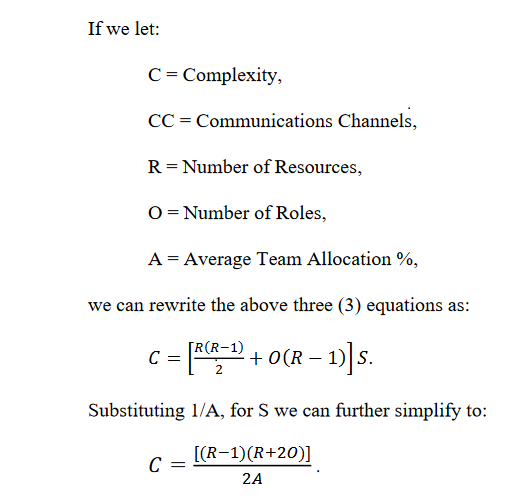
Using the four core complexity factors as described in detail above, we can state the Complexity formula as:

Complexity = (Communication Channels + Roles Complexity) X Stress.

Where,

Communication Channels = [# Resources X (# Resources – 1)  ] / 2,

Roles Complexity = # Roles X (# Resources – 1),

Stress = 1/Team Average Allocation %.


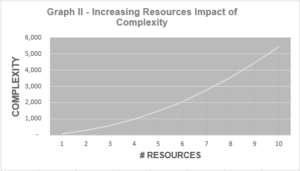
As we can see from the formula, the size of Complexity (C) is most heavily influenced by resources and the average team allocation (A). That can be shown with several graphs. Below is Graph II depicting the impact of increasing resources (R) on Complexity (C) holding both Team Allocation (A) at 100% and Roles (O) at a constant value of five (5).

The effect of increasing the number of resources on a team is exponential.

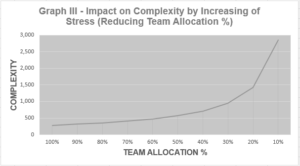
Similarly with Stress (S) as depicted in Graph III below, decreasing the Average Team Allocation % (A), thereby increasing team Stress also has an exponential impact on Complexity (C). In this example, Roles (O) has a constant value of five (5) and Resources a value of twenty (20).

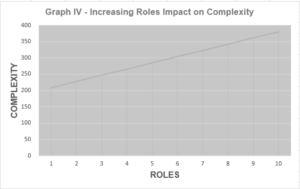
Lastly, examining the impact of increasing the number of roles on a project, Roles (O), while increases complexity, does so at a linear rate, as shown in Graph IV. In this example, the number of Resources (R) has a constant value of 20, and team Allocation (A) has a value of 100%.

Taken all together, this would lend credence to what most Project Managers already know that resource allocation is the most important factor for project success given that all other factors remain constant and that as the team size increases, complexity grows quickly. Roles have an initial impact early on in the project once the scope and requirements are understood, and the team is formed. As more resources are added to the project, their purpose is usually to support existing roles, and/or reduce the project’s duration. Therefore, complexity is impacted, but at a slower rate.

Analysis – Comparing Traditional vs New Model

Let us apply a traditional approach to determine project complexity using a list of five (5) hypothetical projects as shown in Chart III below and then compare it to the complexity model described in this paper. The “traditional approach” described below assumes that the company does not have a PMO board role evaluating project complexity as a part of its intake process. Instead, the process of evaluating complexity typically uses factors such as costs of hardware, software, consulting, and possibly a team size factor of small, medium, and large. Later during the Project Initiation Phase, the number of core or full-time resources are usually detailed by the Project Manager. But generally speaking, at the business executive level, a resource is a resource, it does not matter what they do. Those are generally considered details that the IT Project Manager would need to know. In many organizations, once the PMO Initiation Phase of a project starts, the train has already left the station, so to speak, and the project is launched based upon a very high-level analysis using costs and payback. It then becomes the responsibility of IT Management to figure out how to get it done. And once the traditional complexity scores are determined, they are forever locked in, even as changes are made to the project scope, resources, or allocations. Let’s illustrate a typical traditional approach to determining project complexity using the data below in Chart III.

Projects shown in Chart III are ranked by complexity from highest to lowest. Each has the same duration, and the same team size of twenty (20) associates. Applying the traditional model’s reasoning, shown are the hardware, consulting, and software costs for Project 1 and notice that they are higher than the other projects, implying more complexity. Failure of this project could mean a significant loss of hardware and software investment to the corporation and unrealized gain. Based on that information, this project seems to be the most complex project from an executive-level viewpoint. Looking at Project 2, a similar argument could be made based upon the high cost of the hardware and has high payback, but not quite as high as Project 1. Project 3 has a medium payback, but its cost of consulting and software are the same as the others, but it does not have the hardware cost. Its payback is lower than the project’s 1 and 2. Project 4 has a low payback and no hardware costs, so it is placed at the 4th most complex project. Project 5 is a Corporate Training System that has lower consulting cost, but because its payback is low its been decided to make it a part-time implementation, but keeping to the duration of 60 days. The reasoning is that if it does not get done, the payback is low, and the costs are relatively low, we can always extend the timeline if need be.

Using the same data but applying the complexity formula proposed in this paper, we need to ascertain additional information, as shown in Chart IV below.

The additional three columns added is a further breakdown of the Roles, Allocation percentage, and calculated Stress factor. The calculated Complexity Score column replaced the one used in the traditional model. Much of this new data would not be available generally during the project conceptual phase. It would require a more detailed assessment by an analyst on a PMO team or a knowledgeable Project Manager. The critical point is that the assessment should be done early on, particularly for high payback projects before they get approved. Also, the assessment must consider the impact on other projects already approved and in the portfolio. Approving a new project and moving it into the portfolio could kill another project and completely change its complexity. This is a common mistake made by IT organizations assuming that complexity is a fixed entity.

Based upon the Complexity Score calculated, we get entirely different results. The most complex project is project 5, Corp Training System, with a Complexity Score of 760. There are two reasons for this result. The team size is twenty (20), the same as the other projects, but the team requires ten (10) roles, and the team is part-time based upon executive payback determination. A stress factor of two (2) implies that most everyone on the team is multi-tasking, which means that mistakes will be made, schedules will be missed, meetings will not be well attended due to other obligations. This scenario will make the project manager’s execution and coordination very difficult and complex, even though the process and technology may be relatively simple. The likelihood for successful completion in the time frame of 60 days may only come at the cost of other projects. It is for this reason that this is the most complex project in the list. The next most complex project in this list is project 4, New System 2, it has only two (2) roles, making it less complex than Project 5. Similar to Project 5, it is heavily influenced by its Stress factor of two (2).  Project 3, New System, is the next most complex project. It has ten (10) Roles, but has a fully dedicated team. Skipping to Project 1, while it has the highest cost and payback, it is the second least complex project because it has a fully dedicated team with only three (3) roles. Communication handoff between team members is relatively simple compared to the others. And finally, the least complex project is Project 2, only slightly lower than Project 1 because it has only one (1) role.

In conclusion, as we can observe from the analysis of complexity above, the results between the traditional approach and using the complexity model vary quite significantly.

Conclusion and Practical Application

How can the approach described in this paper be utilized in companies that do not currently have a good practice for determining complexity? The complexity model as proposed in this paper, can most effectively be used by ranking complexity between projects in a portfolio. Project complexity should be recalculated on a recurring basis to identify potential risks as part of the ongoing change management process. The complexity model described in this paper does not consider team knowledge, clarity of objectives, costs, and all the other factors that other complexity models have suggested, so it is not a complete picture for some. However, for most companies, factors of resources, communications, roles, and resource allocations represent 80%+ of the core factors influencing IT project complexity. If these can be managed, then the project and portfolio risks and complexity can be managed resulting in a more efficient and effective organization. Moreover, because the determination of complexity in this model is mathematical, it can be calculated systemically as needed on an ongoing basis with or without a portfolio management system. The additional data points should be welcomed by management. Additional research needs to be done to quantify other variables influencing project complexity and further improve the process of evaluating project complexity.

References

Williamson, D. J. (2012). Assessing the relationships among information technology project complexity, complication, and success. Paper presented at PMI® Research and Education Conference, Limerick, Munster, Ireland. Newtown Square, PA: Project Management Institute.

Hass, K. B. & Lindbergh, L. B. (2010). The bottom line on project complexity: applying a new complexity model. Paper presented at PMI® Global Congress 2010—North America, Washington, DC. Newtown Square, PA: Project Management Institute.

Yugue, R. T. & Maximiano, A. C. A. (2012). Project Complexity and Management Processes. Paper presented at PMI® Research and Education Conference, Limerick, Munster, Ireland. Newtown Square, PA: Project Management Institute.

Hass, K. B. H. (n.d.). Introducing the New Project Complexity Model. Part I. PM Times. Retrieved January 31, 2021, from https://www.projecttimes.com/articles/introducing-the-new-project-complexity-model-part-i.html