This paper proposes a set of core factors that can be utilized to determine IT project complexity. It argues that the factors – number of resources, communications, team stress, and roles mostly determine IT project complexity.
Moreover, these factors can be assembled into an equation to calculate and score project complexity mathematically. The results can then be utilized objectively to evaluate a project’s relative complexity before, during, and after it is initiated. This paper also suggests that using a mathematical method to evaluate project complexity is a more objective and informative approach than using the traditional misleading one-time locked-in subjective complexity data points such as cost and buckets of low, medium, and high.
Introduction
One can look up the definition of project complexity under the PMI Institute, but essentially it is the sum of all factors that could affect the project’s outcome. There is no one widely accepted definition for project complexity. A definition provided (Hass, K. B. & Lindbergh, L. B., 2010), state that “Team size and composition, project duration, schedule, cost and scope flexibility, clarity of the problem and solution, stability of requirements, strategic importance, level of organizational change, inter-project dependencies, political sensitivity, and unproven technology” as the factors affecting project complexity.
Understanding a project’s complexity is essential to know in advance before a project is approved. Management needs to understand the risks involved as failure of a project could mean loss of money, valuable time, and lower employee morale. In this day and age of fast-paced technology, falling behind can sink a company. However, project complexity rarely gets the attention it should receive from executive management at corporations. Most companies do not spend the time doing a thorough analysis of a project’s complexity at the conception or later at the initiation phase. Many only look at the hardware, software, and consulting costs and do not consider the impact on internal resources or the probability of success. This view is particularly true for growing small to medium-sized corporations with no PMO function that review and evaluate projects considering all projects as part of a portfolio (a group of related projects). Most of the time, projects are selected into the portfolio based upon project payback and costs, and project complexity, if evaluated, is bucketed in low, medium, and high categories. And these determinations usually remain a one-time fixed occurrence. Moreover, once a project has been evaluated as having significant payback at the executive level, it becomes difficult to reverse course, even when the project has considerable, yet unknown complexity, and the risk of failure is high.
Quoted from a paper on the subject of project complexity by (Williamson, D. J., 2012), “Even the relatively general findings of this study indicate it may be helpful for practitioners to incorporate an assessment of project complexity into the initiation, planning, and execution phases of all IT projects. Wherever possible, proactive steps to mitigate the likely effects of IT project complexity may help improve the likelihood of IT project success. Further research into the relationships among individual factors and elements will help clarify these relationships”.
Many other scholarly papers have scrutinized a broad spectrum of possible influences on a project’s complexity. Some of these papers have developed evaluation criteria for measuring and determining project complexity. One such paper, (Yugue, R. T. & Maximiano, A. C. A., 2012), cover this topic quite extensively. There are others (Kathleen B. Hass, n.d). However, all the methods detailed in these papers require very knowledgeable and experienced staff who have an intimate understanding of a company’s culture, organizational capabilities, and project requirements. And for companies that do not have that level of sophistication in their organization, using an overly simplistic approach to determining complexity is inadequate and misleading. It allows risks to be introduced into the project or portfolio, which can later turn into major issues. Ultimately driving inefficiencies and waste into the organization.
Some companies utilize enterprise-wide portfolio management systems to evaluate the impact of proposed projects on resources and determine risks. These systems can provide a sophisticated analysis of a portfolio of projects looking at the complete picture of cost, resource conflicts, and an ROI. However, the output of these systems is only as good as the information entered. Implementing such a system in a large organization needs to be holistic and is a monumental project unto itself, and many fail to achieve their goals. Once the system is implemented, it requires corporate investment in highly skilled, trained, and dedicated committed resources. For the companies that can afford it and have many projects, it is a good approach in the long run. But many of these systems do not comprehensively provide methods for determining project complexity on an ongoing basis.
A Different Approach
Wouldn’t it be better to have a more straightforward way of determining project complexity without performing a full-blown assessment but would be more extensive than the standard bucketing approach? Most projects do not have all possible variables influencing their complexity. For example, resources at most companies are knowledgeable, have adequate tools, or the tools they have do not negatively impact projects, and usually, Business Analysts can generate clear requirements, similarly with other resources. It’s reasonable to assume that companies employ qualified resources and do not take on projects that are not a good fit for the organization. In this proposed model, we consider only the major factors that influence at least 80% of a project’s complexity, which is more than adequate for most company projects, particularly IT projects. These factors are referred to as core complexity factors in this paper.
Let us look at a basic way of determining core complexity that is quantitative in its approach and uses information that would be readily available via a project’s charter or some other research provided early in the project. This paper will proceed first to describe in detail each of the four (4) core factors that heavily influence a project’s complexity and then will proceed to explain the impact of each factor on overall project complexity. And finally, tie them together in a formula and describe how it can be applied in an organization.
Methods
Dimension 1 – Resources
The most crucial data used to determine a project’s complexity is its people resources. The number of resources on a project establishes the magnitude of a project and is a core determining factor for a project’s complexity regardless of the goals. In general, as the number of resources increases, so does the complexity. There must be adequate resources to complete the tasks according to the project schedule, and adding more resources to a project may reduce the duration for some activities. For example, a project that requires 2,000 lines of code could be distributed amongst four Developers to generate 500 lines of code each. Nevertheless, as the number of resources increases, the coordination effort, and the communication between resources grows, and so does the complexity, regardless of the duration of selected tasks. Anyone making a required contribution to a project will need to be included as a project resource. These include core participants but also should include subject matter experts, stakeholders, and shared resources. Many times, project management do not include these as part of the team. Anyone participating in a project needs to be accounted for. It also should be noted that a project with knowledgeable resources will be able to complete tasks most efficiently without confusion and delay. However, it is assumed that for this model, all resources are knowledgeable.
Dimension 2 – Communication Channels
As the number of resources increases on a project, the number of possible avenues of communication increases. The PMI Institute defines these as Communication Channels. The formula from PMI Institute is CC = R (R – 1)/2, where R, in this case, is the number of resources. Communication Channels (CC) grows exponentially as R increases. For example, a project with resources A and B will have one communication channel. A project with A, B, and C resources will have three communication channels: A – B, A – C, B – C. There is a high correlation between the number of communication channels and complexity. A task in a project that is not dependent on communication between people is a lower risk task than the same task that requires significant communications.
Below is a graph (Graph I) followed by a chart (Chart I), depicting the relationship between the number of resources and communication channels. As one can see, as the number of resources increases linearly, the number of communications channels grows exponentially. The greater the number of communications required to execute a project successfully, the greater the chance for misunderstanding and risks developing in the handoff between resources. And the greater the complexity.
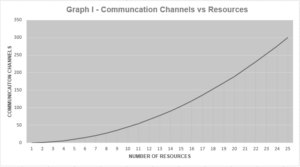
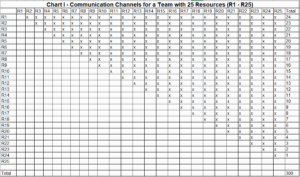
Another way of looking at the communications channels is to depict it as shown below in Chart 1. Each resource (R) can speak with any of the other resources on the project. As we see in this example of a project with 25 resources, there are 300 possible combinations, or using the formula R(R-1)/2; we have 25(24)/2 = 300 Communication Channels.
Dimension 3 – Roles
Expanding the communication channels into further dimensions, one must look at the different levels of expertise required or roles on a project. We will define roles as a group consisting of one or more resources who have the knowledge to perform a set of distinct functions in an organization. Roles add another layer of complexity on top of Communications Channels. Each role consists of a subset of team members working with the entire team to define the requirements, translate the requirements into tasks, and then execute those tasks for one or more customers. Communication between roles is more complex than within the same role. For example, take a software project with five (5) people who all perform the role of Developer. If the project is managed properly, each Developer will already understand the requirements, and each would develop the code required. Since each Developer speaks the same “Developer Language”, communications should be well understood between Developers without significant complexity. Now take another project that needs (1) BA, (1) Developer, (1) DBA, (1) QA Analyst, (1) Network Engineer. Both projects need five (5) resources, the same number of Communication Channels, but the latter project would require handoff and communication between the roles to define, understand, and execute different activities. The Business Analyst (BA) would state the requirements, either as an Agile Story or other requirements document. The requirements document would then need to be reviewed and approved by Stakeholders. After approval of the requirements, Developers will need to review and interpret the documents and develop the code. The Developers would then need to work with the DBAs to define and create the databases. In most situations, the outcome of the coding always needs testing by QA followed by some revamping to align with requirements. It would be a similar situation with the Network Engineers; the requirements such as firewall rules and IT Security would need to be defined, reviewed, and executed.
Therefore, in this simple example above, it is entirely clear that as the number of roles increases on a project, so does its complexity. Furthermore, it is not unreasonable to state that the size of the team significantly influences its impact on complexity. The exact determination depends on each project, but in general, roles on a large project have more requirements to satisfy, more communications, and more work to execute. Chart II below depicts that work effort as the possible combinations of communications. As can be seen, the greater the number of roles, the greater the complexity.
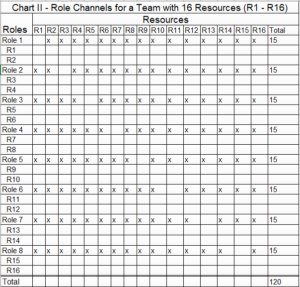
Roles in Chart II consist of eight (8) groups of people; each role has two (2) resources for illustration purposes. Each role will need to work with the other individual team members to define and execute the requirements. So, for Role 1, R1 communicates with resources R2 – R16. For Role 2, R3 communicates with R1, R2, and R4 – R16, so on and so forth. Therefore, the equation that states the magnitude of that relationship is given by the formula:
Role Complexity = Number of Roles X (Resources – 1).
Unlike the Communication Channels, the order of the relationship is important so that for example, the relationship of Role 1 – R2 is not the same as R2 – Role 1.
Dimension 4 – Stress and Average Team Allocation %
The dimension with the most significant potential for risk and complexity on a project is Stress (S).
Stress is defined as:
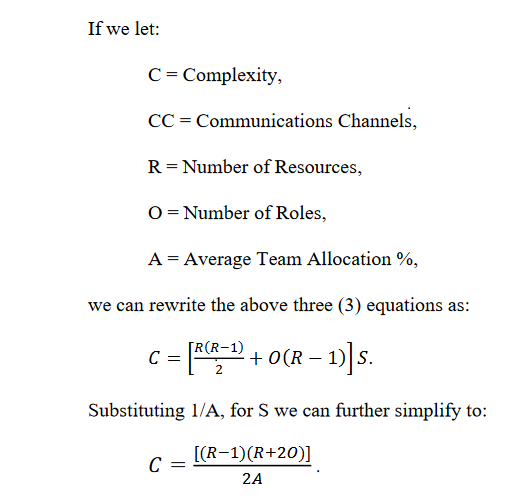
S = 1 / Team Average Allocation %
Stress is the average % of time the team is allocated to the project, totaling each team member’s average allocation % and dividing it into 1. The higher the number S, the greater the stress on a project, the greater the complexity, and risk to the project. The ideal situation for a team working on a project is a dedicated co-located team setting where everyone is close by and spending 100% of their time on the project. In this situation, communication between team members flows most efficiently. There are no shared resources or multi-tasking on other projects. All resources to complete all the tasks are on the team. In this approach, Stress (S) is equal to 1 and is the lowest value for S.
Advertisement
[widget id=”custom_html-68″]
This “co-location” approach also happens to be the most expensive of the options. Most companies will have multi-tasking resources working on several projects across a portfolio of projects. Resources that multi-task fall into three categories: shared resources, subject-matter experts (SMEs), and part-time team members. Shared resources are usually those that belong to resource “pools” like DBAs, networking, server engineers, etc. SMEs are those people who have knowledge in an area that can benefit a team, particularly when defining up-front requirements or design of a product. Part-time resources are those resources that are splitting up their time between projects. And the greater the number of multi-tasking resources on a project, the greater the stress. As stress levels increase on team members, communications must be tightened for multi-tasking team members, and execution must become more precise. Sometimes the team members must work overtime to meet total work commitments, but the risk of making errors increases dramatically. Everyone has heard someone say, “Don’t rush me, or I am going to make a mistake”. In these situations, project stress factors can vary weekly, making the project manager’s job much more difficult.
In this complexity model, all resources that could add complexity to the project must be accounted for. There is no one-size-fits-all approach; the Project Manager using this model will need to distinguish between ‘availability’ of a resource and ‘allocation’. If shared resources are well-staffed and have virtually infinite capacity, then it would be best to leave those resources from the Stress equation. The same reasoning could apply to SMEs if their time requirement is low. The more concerning of the multi-tasking resources are those who are stretched thin, bouncing between projects. Examples of these could be Project Managers working on multiple projects, Developers, Network Engineers, or QA resources.
Each project resource allocation will have to be evaluated appropriately by the Project Manager or Analyst performing the complexity evaluation.
Complexity Formula – Describing Complexity as a Formula
Using the four core complexity factors as described in detail above, we can state the Complexity formula as:
Complexity = (Communication Channels + Roles Complexity) X Stress.
Where,
Communication Channels = [# Resources X (# Resources – 1) ] / 2,
Roles Complexity = # Roles X (# Resources – 1),
Stress = 1/Team Average Allocation %.
As we can see from the formula, the size of Complexity (C) is most heavily influenced by resources and the average team allocation (A). That can be shown with several graphs. Below is Graph II depicting the impact of increasing resources (R) on Complexity (C) holding both Team Allocation (A) at 100% and Roles (O) at a constant value of five (5).
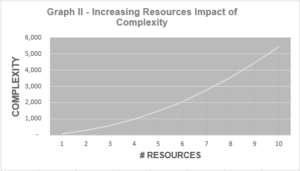
The effect of increasing the number of resources on a team is exponential.
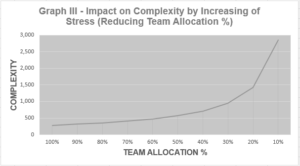
Similarly with Stress (S) as depicted in Graph III below, decreasing the Average Team Allocation % (A), thereby increasing team Stress also has an exponential impact on Complexity (C). In this example, Roles (O) has a constant value of five (5) and Resources a value of twenty (20).
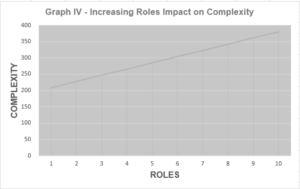
Lastly, examining the impact of increasing the number of roles on a project, Roles (O), while increases complexity, does so at a linear rate, as shown in Graph IV. In this example, the number of Resources (R) has a constant value of 20, and team Allocation (A) has a value of 100%.
Taken all together, this would lend credence to what most Project Managers already know that resource allocation is the most important factor for project success given that all other factors remain constant and that as the team size increases, complexity grows quickly. Roles have an initial impact early on in the project once the scope and requirements are understood, and the team is formed. As more resources are added to the project, their purpose is usually to support existing roles, and/or reduce the project’s duration. Therefore, complexity is impacted, but at a slower rate.
Analysis – Comparing Traditional vs New Model
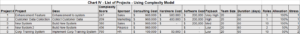
Let us apply a traditional approach to determine project complexity using a list of five (5) hypothetical projects as shown in Chart III below and then compare it to the complexity model described in this paper. The “traditional approach” described below assumes that the company does not have a PMO board role evaluating project complexity as a part of its intake process. Instead, the process of evaluating complexity typically uses factors such as costs of hardware, software, consulting, and possibly a team size factor of small, medium, and large. Later during the Project Initiation Phase, the number of core or full-time resources are usually detailed by the Project Manager. But generally speaking, at the business executive level, a resource is a resource, it does not matter what they do. Those are generally considered details that the IT Project Manager would need to know. In many organizations, once the PMO Initiation Phase of a project starts, the train has already left the station, so to speak, and the project is launched based upon a very high-level analysis using costs and payback. It then becomes the responsibility of IT Management to figure out how to get it done. And once the traditional complexity scores are determined, they are forever locked in, even as changes are made to the project scope, resources, or allocations. Let’s illustrate a typical traditional approach to determining project complexity using the data below in Chart III.
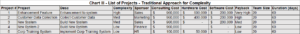
Projects shown in Chart III are ranked by complexity from highest to lowest. Each has the same duration, and the same team size of twenty (20) associates. Applying the traditional model’s reasoning, shown are the hardware, consulting, and software costs for Project 1 and notice that they are higher than the other projects, implying more complexity. Failure of this project could mean a significant loss of hardware and software investment to the corporation and unrealized gain. Based on that information, this project seems to be the most complex project from an executive-level viewpoint. Looking at Project 2, a similar argument could be made based upon the high cost of the hardware and has high payback, but not quite as high as Project 1. Project 3 has a medium payback, but its cost of consulting and software are the same as the others, but it does not have the hardware cost. Its payback is lower than the project’s 1 and 2. Project 4 has a low payback and no hardware costs, so it is placed at the 4th most complex project. Project 5 is a Corporate Training System that has lower consulting cost, but because its payback is low its been decided to make it a part-time implementation, but keeping to the duration of 60 days. The reasoning is that if it does not get done, the payback is low, and the costs are relatively low, we can always extend the timeline if need be.
Using the same data but applying the complexity formula proposed in this paper, we need to ascertain additional information, as shown in Chart IV below.
The additional three columns added is a further breakdown of the Roles, Allocation percentage, and calculated Stress factor. The calculated Complexity Score column replaced the one used in the traditional model. Much of this new data would not be available generally during the project conceptual phase. It would require a more detailed assessment by an analyst on a PMO team or a knowledgeable Project Manager. The critical point is that the assessment should be done early on, particularly for high payback projects before they get approved. Also, the assessment must consider the impact on other projects already approved and in the portfolio. Approving a new project and moving it into the portfolio could kill another project and completely change its complexity. This is a common mistake made by IT organizations assuming that complexity is a fixed entity.
Based upon the Complexity Score calculated, we get entirely different results. The most complex project is project 5, Corp Training System, with a Complexity Score of 760. There are two reasons for this result. The team size is twenty (20), the same as the other projects, but the team requires ten (10) roles, and the team is part-time based upon executive payback determination. A stress factor of two (2) implies that most everyone on the team is multi-tasking, which means that mistakes will be made, schedules will be missed, meetings will not be well attended due to other obligations. This scenario will make the project manager’s execution and coordination very difficult and complex, even though the process and technology may be relatively simple. The likelihood for successful completion in the time frame of 60 days may only come at the cost of other projects. It is for this reason that this is the most complex project in the list. The next most complex project in this list is project 4, New System 2, it has only two (2) roles, making it less complex than Project 5. Similar to Project 5, it is heavily influenced by its Stress factor of two (2). Project 3, New System, is the next most complex project. It has ten (10) Roles, but has a fully dedicated team. Skipping to Project 1, while it has the highest cost and payback, it is the second least complex project because it has a fully dedicated team with only three (3) roles. Communication handoff between team members is relatively simple compared to the others. And finally, the least complex project is Project 2, only slightly lower than Project 1 because it has only one (1) role.
In conclusion, as we can observe from the analysis of complexity above, the results between the traditional approach and using the complexity model vary quite significantly.
Conclusion and Practical Application
How can the approach described in this paper be utilized in companies that do not currently have a good practice for determining complexity? The complexity model as proposed in this paper, can most effectively be used by ranking complexity between projects in a portfolio. Project complexity should be recalculated on a recurring basis to identify potential risks as part of the ongoing change management process. The complexity model described in this paper does not consider team knowledge, clarity of objectives, costs, and all the other factors that other complexity models have suggested, so it is not a complete picture for some. However, for most companies, factors of resources, communications, roles, and resource allocations represent 80%+ of the core factors influencing IT project complexity. If these can be managed, then the project and portfolio risks and complexity can be managed resulting in a more efficient and effective organization. Moreover, because the determination of complexity in this model is mathematical, it can be calculated systemically as needed on an ongoing basis with or without a portfolio management system. The additional data points should be welcomed by management. Additional research needs to be done to quantify other variables influencing project complexity and further improve the process of evaluating project complexity.
References
Williamson, D. J. (2012). Assessing the relationships among information technology project complexity, complication, and success. Paper presented at PMI® Research and Education Conference, Limerick, Munster, Ireland. Newtown Square, PA: Project Management Institute.
Hass, K. B. & Lindbergh, L. B. (2010). The bottom line on project complexity: applying a new complexity model. Paper presented at PMI® Global Congress 2010—North America, Washington, DC. Newtown Square, PA: Project Management Institute.
Yugue, R. T. & Maximiano, A. C. A. (2012). Project Complexity and Management Processes. Paper presented at PMI® Research and Education Conference, Limerick, Munster, Ireland. Newtown Square, PA: Project Management Institute.
Hass, K. B. H. (n.d.). Introducing the New Project Complexity Model. Part I. PM Times. Retrieved January 31, 2021, from https://www.projecttimes.com/articles/introducing-the-new-project-complexity-model-part-i.html